Figure 6.
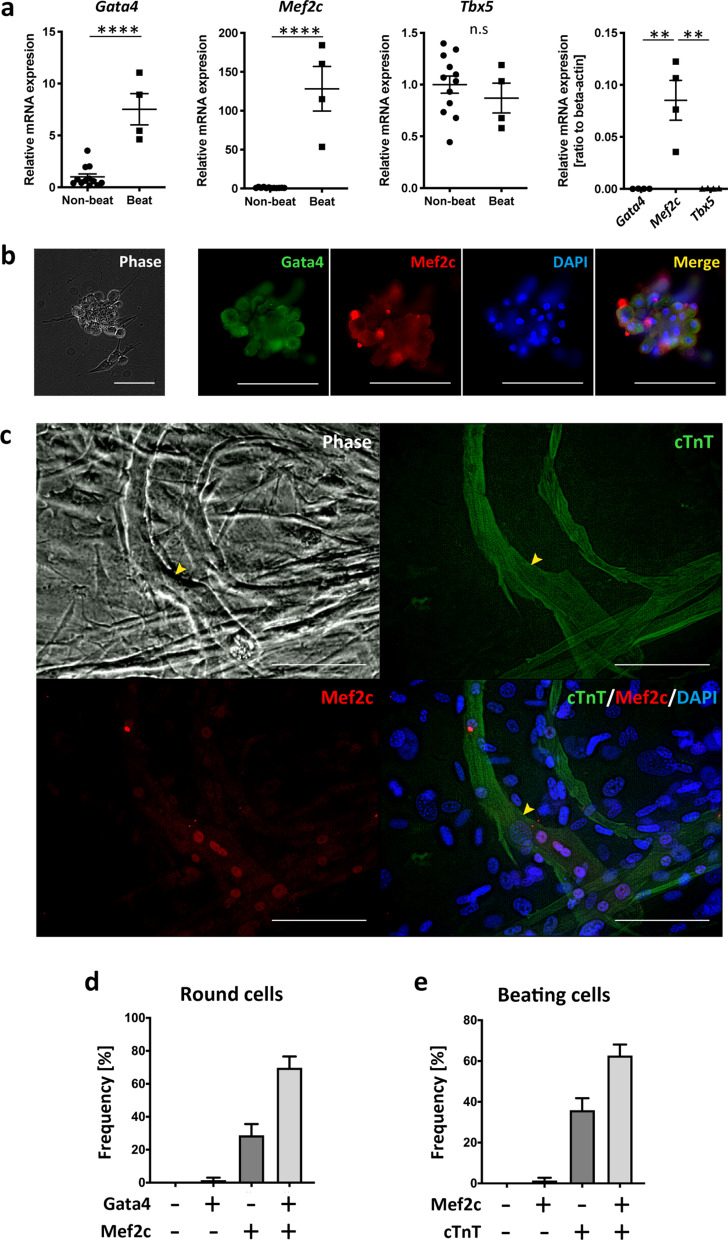
Gata4, Mef2c, and Tbx5 expression in the beating and non-beating groups. (a) Left three panels, gene expression levels in the beating and non-beating group. Right panel, gene expression levels in the beating and non-beating group relative to that of β-actin. (b) Representative immunofluorescence images of a cluster of round cells expressing Gata4 and Mef2c on day 14. (c) Phase-contrast and immunofluorescence images of beating cells expressing cardiac troponin T (cTnT) and Mef2c on day 28. The arrowhead indicates a beating cell. Scale bar, 100 µm. DAPI, 4′,6-diamidino-2-phenylindole, ** p < 0.01; **** p < 0.0001 by t-test or ANOVA and Tukey’s post hoc test. (d) The frequency of round cells expressing Gata4 and Mef2c (10 round cells were examined per experiment, n = 13). (e) The frequency of beating cells expressing Mef2c and cTnT (15 beating cells were analysed per experiment, n = 4).

