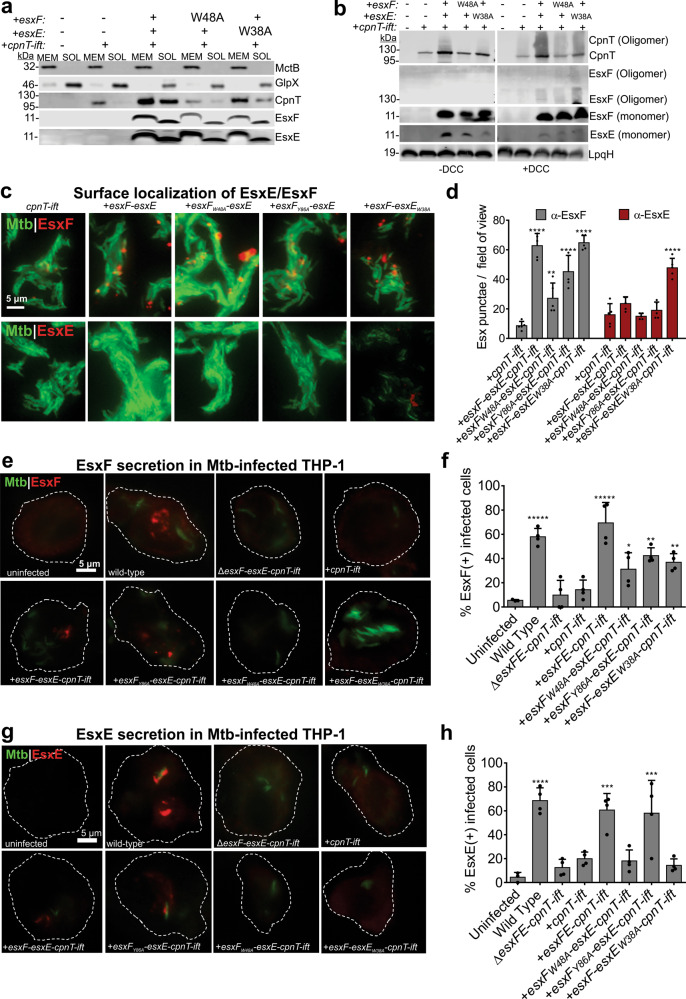
Fig. 3. Subcellular localization and secretion of EsxE and EsxF.
a Subcellular localization of the indicated Mtb strains. Immunoblot analysis shows water soluble (SOL) and membrane (MEM) fractions obtained by ultracentrifugation. GlpX and MctB were used as water-soluble and membrane-bound controls, respectively. CpnT was detected using an antibody against the TNT domain. Representative blots shown from two independent experiments. b Detection of oligomeric CpnT and EsxF in immunoblots of Mtb lysates with or without cross-linking with dicyclohexyl carbodiimide before cell lysis. LpqH served as a loading control. Experiment was performed once. c Detection of surface-exposed EsxF or EsxE by fluorescence microscopy of the indicated Mtb strains labeled with the metabolic dye DMN-trehalose, and stained with polyclonal anti-EsxF or EsxE antibody and donkey anti-rabbit-AlexaFluor-594 secondary antibody. Scale = 10 µm. Representative of three experiments shown. d Quantification of EsxF or EsxE punctae in images shown in c using NIH ImageJ. Data are represented as mean ± SD. P < 0.0001 calculated using one-way ANOVA with Dunnet’s multiple comparison test as compared to the +cpnT-ift strain for nonspecific antibody binding. Representative analysis from one of three separate experiments with identical trends. Detection of secreted EsxF (e, f) and EsxE (g, h) in the cytosol of infected macrophages. Fluorescence microscopy of THP-1 macrophages 48 h after infection with DMN-TRE-labeled Mtb. Cells were fixed and treated with digitonin to permeabilize the plasma membrane. Cells were stained with polyclonal anti-EsxF or anti-EsxF antiserum and donkey anti-rabbit-AlexaFluor-594 secondary antibody. The results are representative of four independent experiments. Quantification of the images shown in f and h. Infected macrophages were scored as EsxF+ and EsxE+ by the presence of bright red punctae compared to the negative controls. The data are represented as % EsxF- and EsxE-positive cells over at least 100 cells from four independent experiments. Data are represented as mean ± SD. P < 0.0001 calculated using one-way ANOVA with Dunnet’s multiple comparison test. Source data are provided in the Source data file.

