
Fig. 3. Attentive motion discrimination leads to distinct activations and inactivation in occipital, temporal, parietal, and frontal lobes.
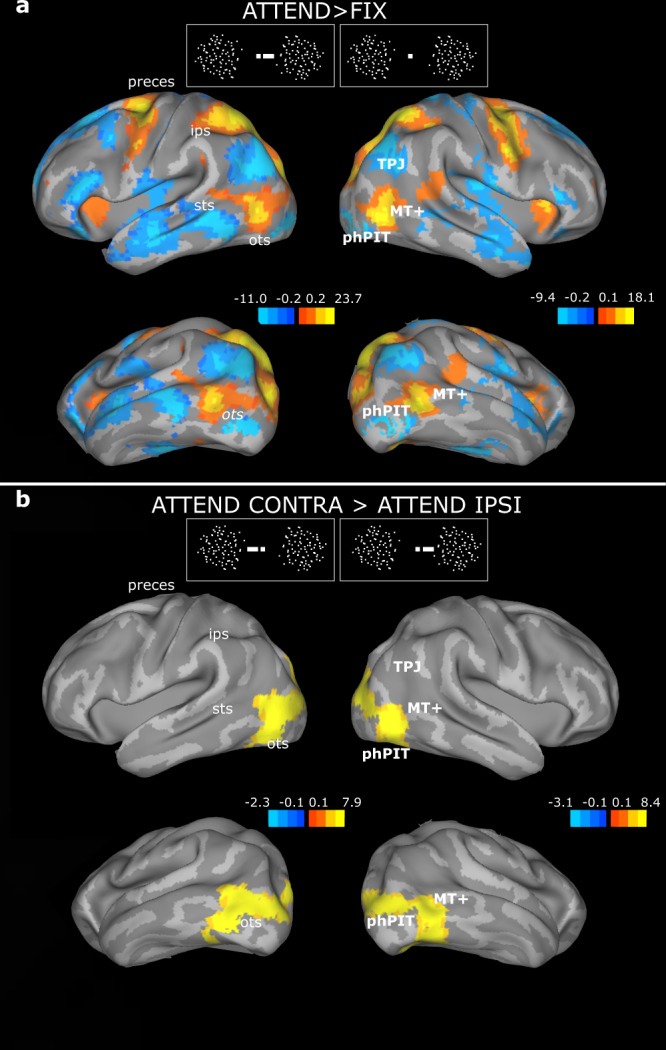
a Statistical parametric maps of the contrast ‘attention (ATTEND) vs. fixation (FIX)’ overlaid on the lateral and inferior views of the inflated average human brain. The color-bar shows T-values task-related activations (yellow/red) and inactivation (blue). b Statistical parametric maps of the contrast ‘attend contralaterally (CONTRA) versus ipsilaterally (IPSI)’. Conventions as in A. One GLM analysis was performed for the whole brain. The contrasts attention Right > Left and Left > Right are shown in the left and right column, respectively, i.e., attention contralateral > ipsilateral. The color-bar shows T-values task-related activations; for visualization purposes, a slightly different threshold is displayed for the left and right hemisphere to highlight activation similarities; the full range of the color-bars is used; dark orange shades are only visible at the edges. sts superior temporal sulcus, ips intraparietal sulcus, as arcuate sulcus, ots occipito-temporal sulcus, MT+ middle temporal area, phPIT putative human Posterior Infero-Temporal area, TPJ temporo-parietal junction.