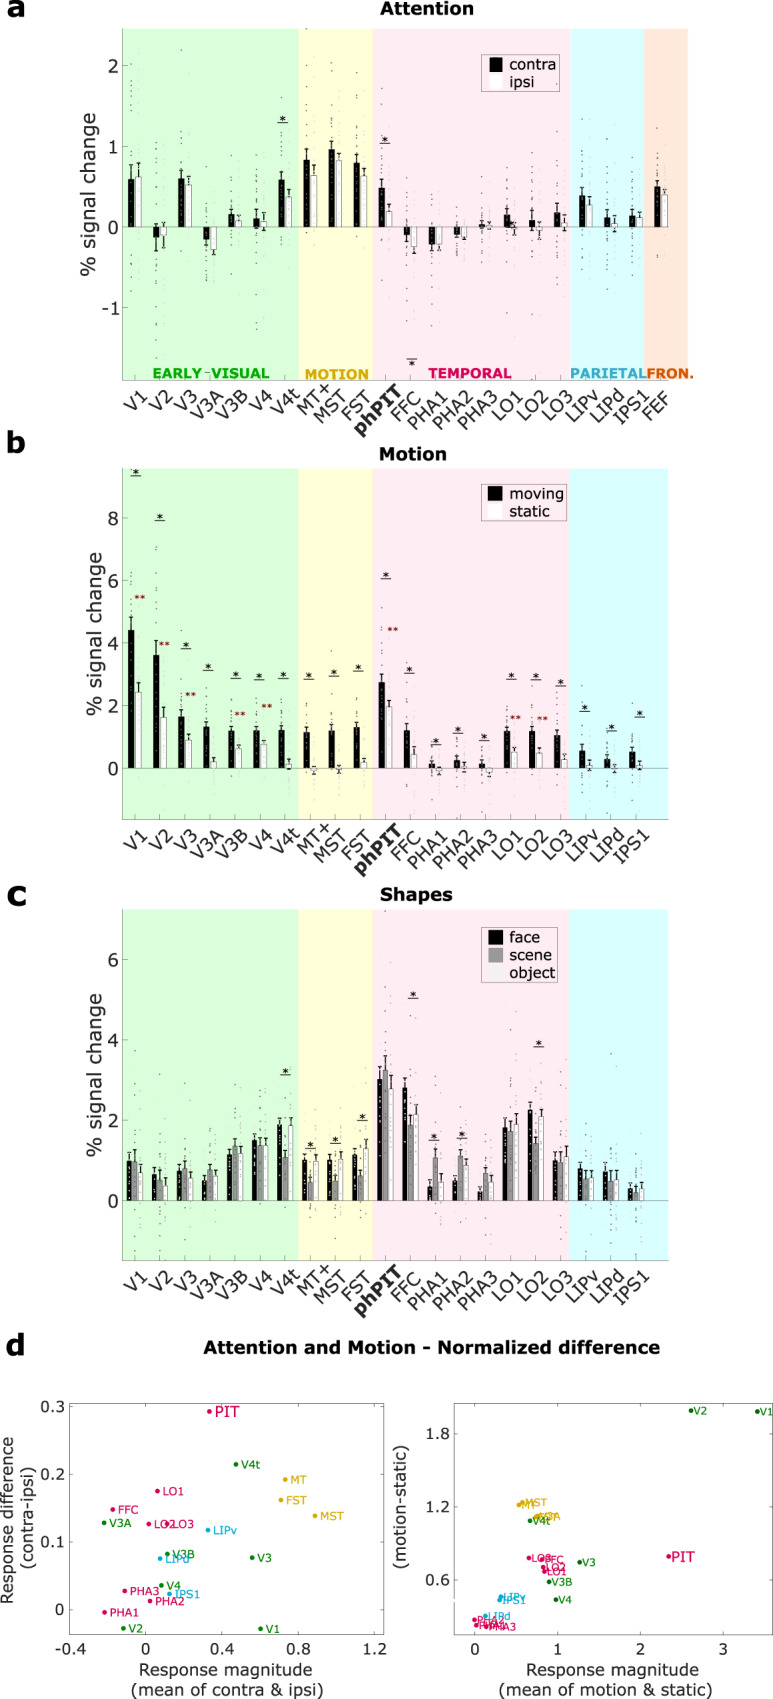
Fig. 5. Comparative functional profile of cortical ROIs in the occipital, temporal, parietal, and frontal lobes.

a Attentional modulation; the bar plot shows the average percentage signal change across subjects for each ROI, expressed as mean across 24 hemispheres; gray points represent the values for left and right hemispheres of each individual subject. Signal extracted during the attend contralateral (Attend contra) and the attend ipsilateral (Attend ipsi) condition are shown in black and gray, respectively. Black asterisks indicate a significantly stronger response differences for attended than for unattended condition (p < 0.05, one-sided paired t-test uncorrected for multiple comparisons; exact p-values are reported in Supplementary Table 2); b ROI responses to motion and static stimuli; bar plots show the average percentage signal change across subjects for each ROI in response to moving and static stimuli, expressed as mean across 20 hemispheres; gray points represent the values for each individual subject; red asterisks indicate a significant response for static stimuli p < 0.05, one-sided t-test uncorrected for multiple comparisons; exact p-values are reported in Supplementary Table 2; black asterisks indicate a significantly stronger response differences for moving than for static stimuli p < 0.05, one-sided paired t-test uncorrected for multiple comparisons; exact p-values are reported in Supplementary Table 2. c ROI responses to three shape categories; bar plots show the average percentage signal change across subjects for each ROI in response to faces-scenes-objects, expressed as mean across 18 hemispheres; gray points represent the values for each individual subject and hemispheres; black asterisks indicate significantly different responses for the three different stimulus categories (p < 0.05, one-way ANOVA uncorrected for multiple comparisons; exact p-values are reported in Supplementary Table 2). d Attention and motion modulation profiles of ROIs relative to mean activation. Scatter plots show activation differences (vertical axis) as a function of average activation (horizontal axis) during the attention task (left) and the motion localizer (right). The ratio of response difference and response magnitude defines the attention index. V1-2-3-3A-3B-4 visual areas 1-2-3-3A-3B-4, V4t visual area 4 transition, MT+ middle temporal area, MST medial superior temporal area, FST fundus of the superior temporal sulcus, phPIT putative human Posterior Infero-Temporal area, FFC fusiform Face Area, PH1-2-3 para-hippocampal area 1-2-3, LO1-2-3 lateral occipital areas 1-2-3, LIPv ventral latera intraparietal area, LIPd dorsal latera intraparietal area, IPS1 intra parietal sulcus 1, FEF frontal eye field. Source data are provided as a Source Data file.
