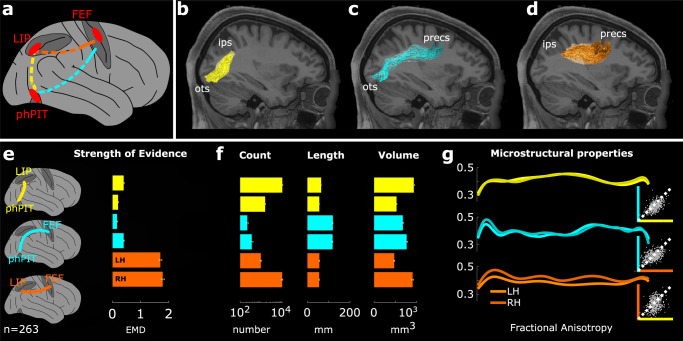
Fig. 6. Human dorso-ventral attentional connection identified using tractography.
a Schematic connections; phPIT–LIP: yellow trace; phPIT–FEF: cyan trace; LIP–FEF: orange trace. b–d Sagittal-view of phPIT-to-LIP, phPIT-to-FEF, and LIP-to-FEF connections overlaid on T1 image for subject 101006. Conventions as in Fig. 1. e The bar plot shows the mean earth mover’s distance (EMD; see also Methods) in support of the existence of the tracts; lower bars for each tract represent the average across the right hemisphere, upper bars across the left. f Bar plots show the average streamline number, tract length (mm), tract volume (mm3) for functional tracts of 263 subjects; lower bars for each tract represent the average across the right hemisphere, upper bars across the left. g Microstructural properties of functional tracts as measured by fractional anisotropy (FA; see Methods). Each line represents the FA value averaged across subjects and calculated along the tract. Insets show direct comparison of individual subject FA between phPIT–LIP and phPIT–FEF connections (top), LIP–FEF and phPIT–FEF connections (middle), phPIT–LIP and LIP–FEF connections (bottom). Data are expressed as mean across 263 subjects, and separately for the two hemispheres; gray points represent the values for each individual subject. ips intra-parietal sulcus, ots occipito-temporal sulcus, sts superior temporal sulcus, preces pre-central sulcus, FEF frontal eye field, LIP lateral intra parietal area, phPIT putative human posterior infero-temporal area, LH left hemisphere, RH right hemisphere. Source data are provided as a Source Data file.

