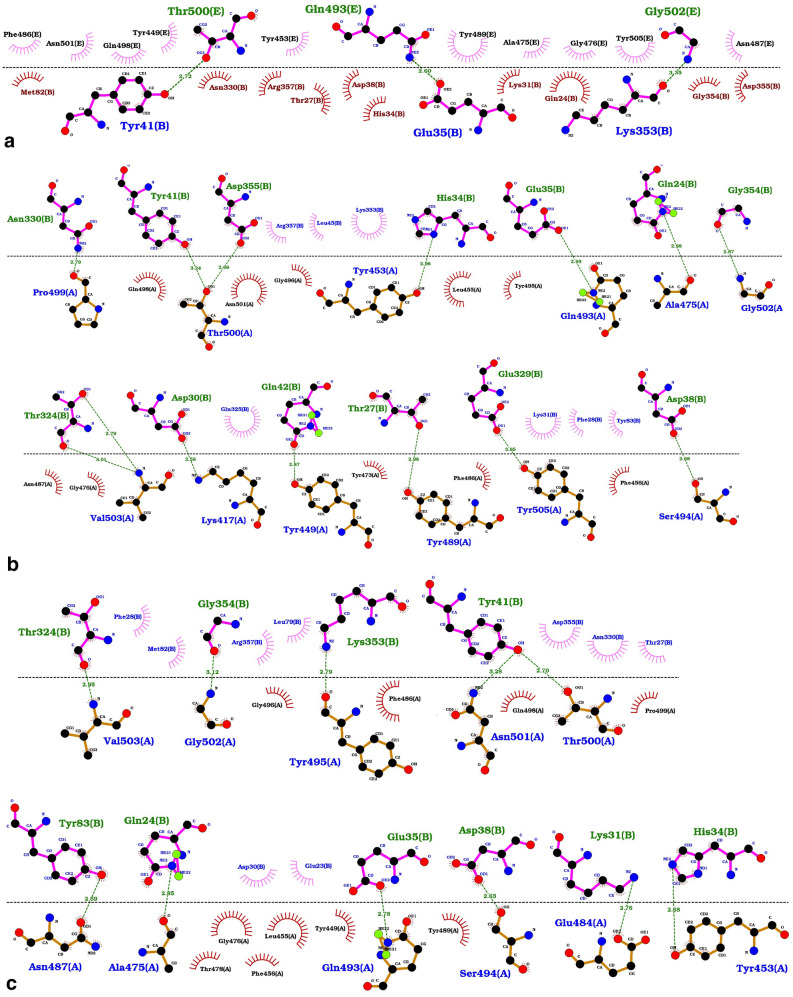
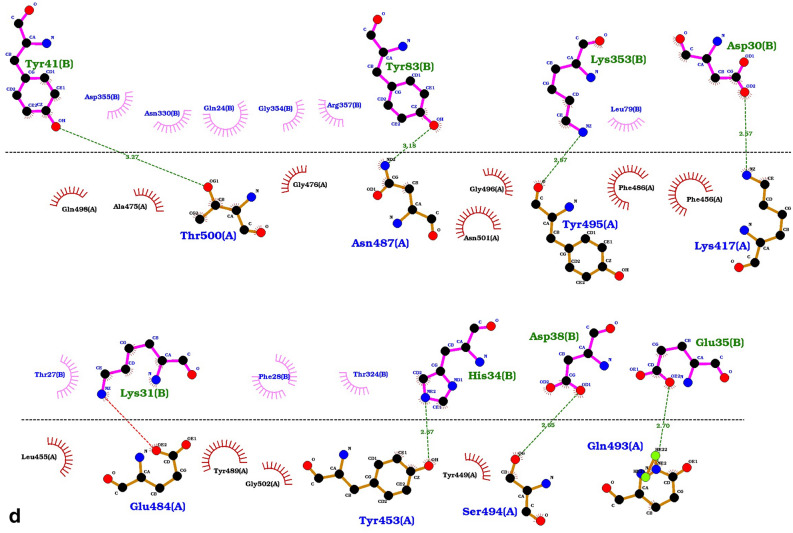
Figure 6.
Spike-ACE2 interaction details. The hydrogen and hydrophobic bonds within different ACE2-Spike protein complexes. The ACE2 residues have been labeled by “B” letter and the Spike protein residues have been shown by “A”. The green line represents the hydrogen bonds. Residues involved in hydrogen bonds have been shown in blue and green colors, while brown and black colors are used for hydrophobic interactions. The length of the hydrogen bonds is determined by the angstrom. (a) Experimental 6M17chainB-6M17chainA complex; (b) Simulated Spike-ACE2 complex; (c) Simulated Spike-ACE2(Lyz26 >Arg) complex; (d) Simulated Spike-ACE2(Ser331 >Phe) complex.


