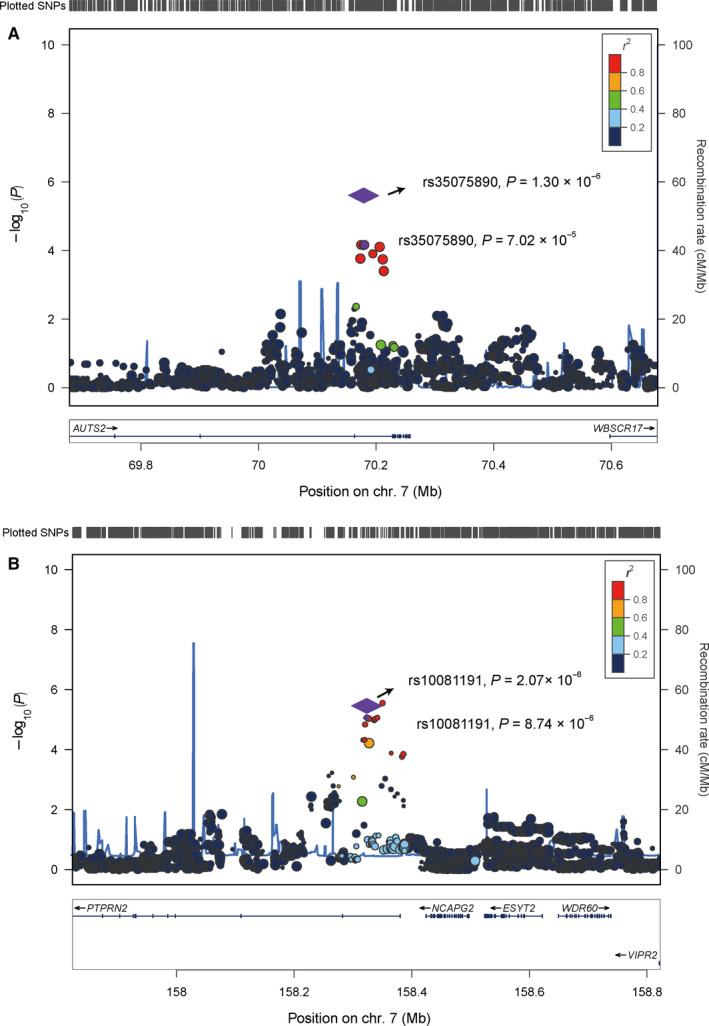
Figure 3.

Regional plots for the associations in regions surrounding the rs35075890 and rs10081191 in the discovery stage. Genomic positions are based on NCBI Build 37. In the meta‐analyses, the P values of the SNPs were shown as purple diamonds, with their initial P values in the discovery stage shown as purple dots. The linkage disequilibrium (LD) values (r 2) to rs35075890 and rs10081191 for the other SNPs are indicated by marker colour. Red signifies r 2 > 0.8, orange 0.6 < r 2 ≤ 0.8, green 0.4 < r 2 ≤ 0.6, light blue 0.2 < r 2 ≤ 0.4 and blue r 2 ≤ 0.2. Estimated recombination rates, which are derived from the Asian population of the 1000 Genomes Project (Version 3, Nov 2014), are plotted in blue. Genes within the 500 Kb region surrounding the index SNPs rs35075890 (A) and rs10081191 (B) are annotated, with the positions of transcripts shown by arrows
