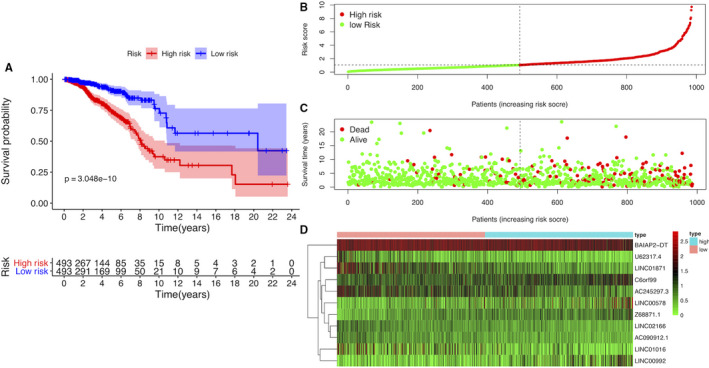
Figure 2.

The prognostic value of the risk model of the 11 autophagy‐related lncRNAs in the TCGA cohort. A, Kaplan‐Meier survival analysis of the high‐risk and low‐risk groups based on the risk model and median risk score. B, The risk curve based on the risk score of each sample. C, The scatterplot based on the survival status of each sample. The green and red dots represent survival and death, respectively. D, The heatmap displayed the expression levels of autophagy‐related lncRNAs in the high‐risk and low‐risk groups
