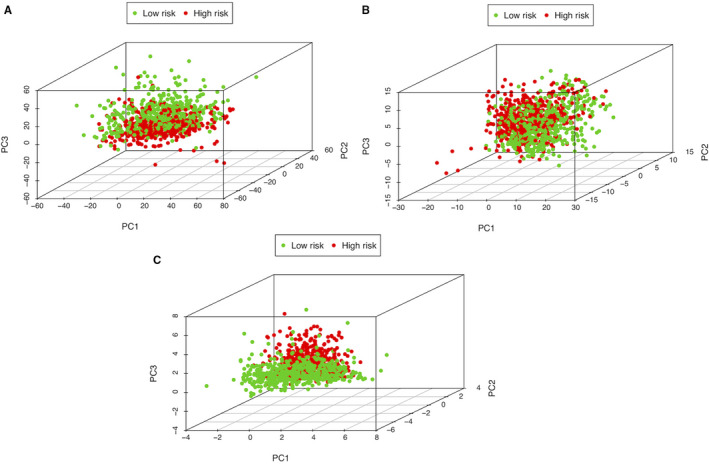
Figure 5.

The low‐risk and high‐risk groups displayed different autophagy statuses. A‐C, Principal component analysis (PCA) between low‐risk and high‐risk groups based on the whole‐genome, autophagy‐related encoding genes and the risk model of the 11 autophagy‐related lncRNA expression profiles.
