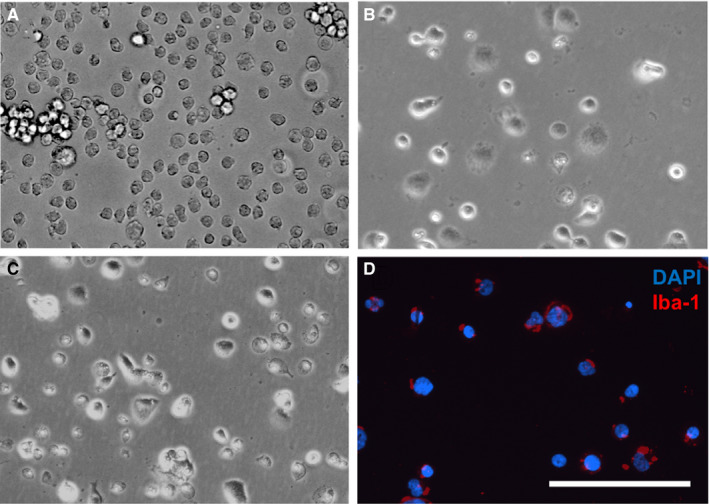
Figure 1.

(A‐D) Morphological changes of THP‐1 monocytes during differentiation and after Aβ42 treatment. (A) Undifferentiated human THP‐1 monocytes are free‐floating and have a rounded shape. (B) Incubation of the cells for 72 h with 50 ng/mL PMA resulted in differentiation to a macrophage phenotype (d‐THP‐1 cells). The cells have attached to the culture plates and become elongated and flattened. (C) After incubation of the d‐THP‐1 cells with 5 μmol/L Aβ42 for 24 h, the cells clustered together and displayed a heterogeneous morphology with different sizes and shapes. (D) The micrograph shows staining for Iba‐1 (red fluorescence) in untreated d‐THP‐1 cells. The cell nuclei were stained by DAPI (blue fluorescence). All micrographs are of the same magnification and the bar indicates 200 µm. Aβ = β‐amyloid; DAPI = 4',6‐diamidino‐2‐phenylindole; Iba‐1 = ionized calcium‐binding adapter molecule 1; PMA = phorbol 12‐myristate 13‐acetate
