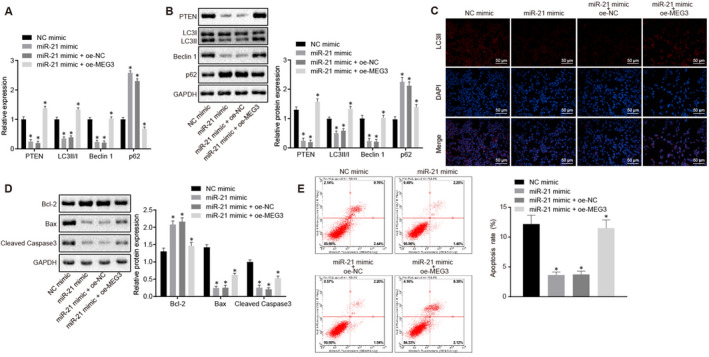
FIGURE 4.

MEG3 down‐regulated miR‐21 to stimulate the apoptosis and autophagy of NPC cells. In this experiment, HK‐1 cells were treated with NC mimic, miR‐21 mimic, miR‐21 mimic plus oe‐NC and miR‐21 mimic plus oe‐MEG3. A, Relative expression of PTEN, LC3 II/I, Beclin1 and P62 in HK‐1 cells after different treatments. B, Western blot analysis of PTEN, LC3 II/I, Beclin1 and P62 proteins in HK‐1 cells after different treatments. C, Immunofluorescence image of LC3 II/I in HK‐1 cells after different treatments (×200). D, Western blot analysis of Cleaved‐Caspase3, Bcl‐2, Bax and GAPDH proteins in HK‐1 cells with different treatments. E, Flow cytometry analysis of apoptosis and apoptosis rate in HK‐1 cells after different treatments. *P < .05 vs. cells treated with the NC mimic or miR‐21 mimic plus oe‐NC. The measurement data were described as mean ± standard deviation. An unpaired t test was used to test the comparison between the two groups. Three independent experiments were performed
