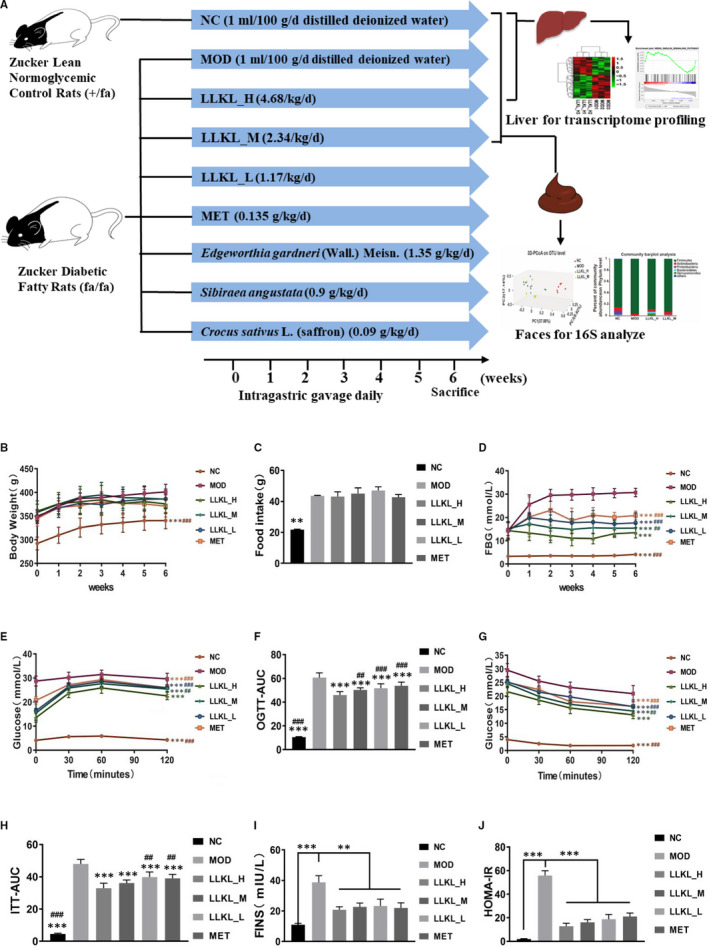
Figure 2.

LLKL treatment alleviates insulin resistance in ZDF rats. A, Schematic diagram of the animal experiment. B, BW, (C) food intake, (D) FBG, (E) curve of OGTT, (F) AUC of OGTT, (G) curve of ITT, (H) AUC of ITT, (I) FINS and (J) HOMA‐IR of NC, MOD, LLKL_H, LLKL_M, LLKL_L and MET treatment groups. Data were shown as means ± SD (n = 8, *P < .05, **P < .01, ***P < .001 vs the MOD group; # P < .05, ## P < .01, ### P < .001 vs the LLKL_H group)
