
FIGURE 2.
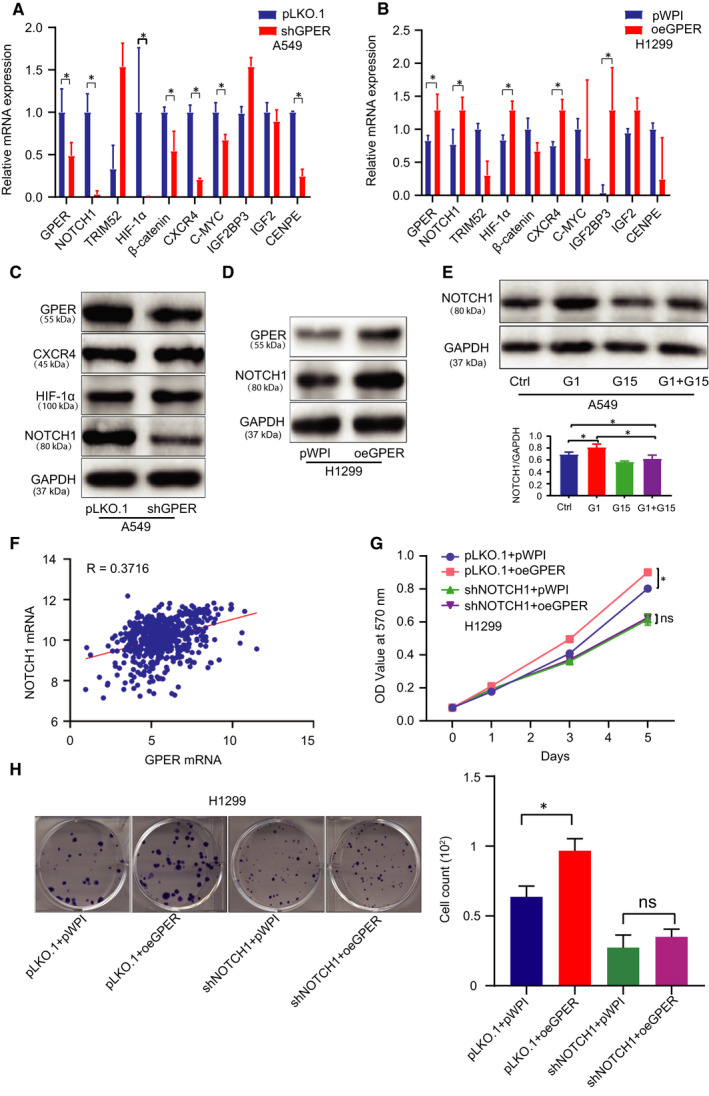
GPER promoted NSCLC growth via up‐regulating the expression level of NOTCH1. (A, B) The expression levels of cell growth/proliferation‐related oncogenes mRNA were detected by qRT‐PCR in A549 cells treated w/wo shGPER and in H1299 cells treated w/wo oeGPER. (C) The protein expression levels of the potential oncogene candidates were detected using Western blot in A549 cells after GPER knock‐down. (D) Western blot was conducted to examine NOTCH1 expression in H1299 cells after the overexpression of GPER. (E) NOTCH1 was detected in A549 cells treated with G1, G15 or G1 + G15. (F) Correlation between GPER and NOTCH1 was analysed from the TCGA data. (G) MTT assay was performed using H1299 cells transfected as indicated: pLKO.1 + pWPI, pLKO.1 + oeGPER, shNOTCH1 + pWPI, shNOTCH1 + oeGPER. (H) Colony formation assay was performed using H1299 cells transfected as indicated: pLKO.1 + pWPI, pLKO.1 + oeGPER, shNOTCH1 + pWPI, shNOTCH1 + oeGPER, and quantification was at the right. Quantitation was presented as mean ± SD, and P values were calculated by t test, *P < .05