
FIGURE 3.
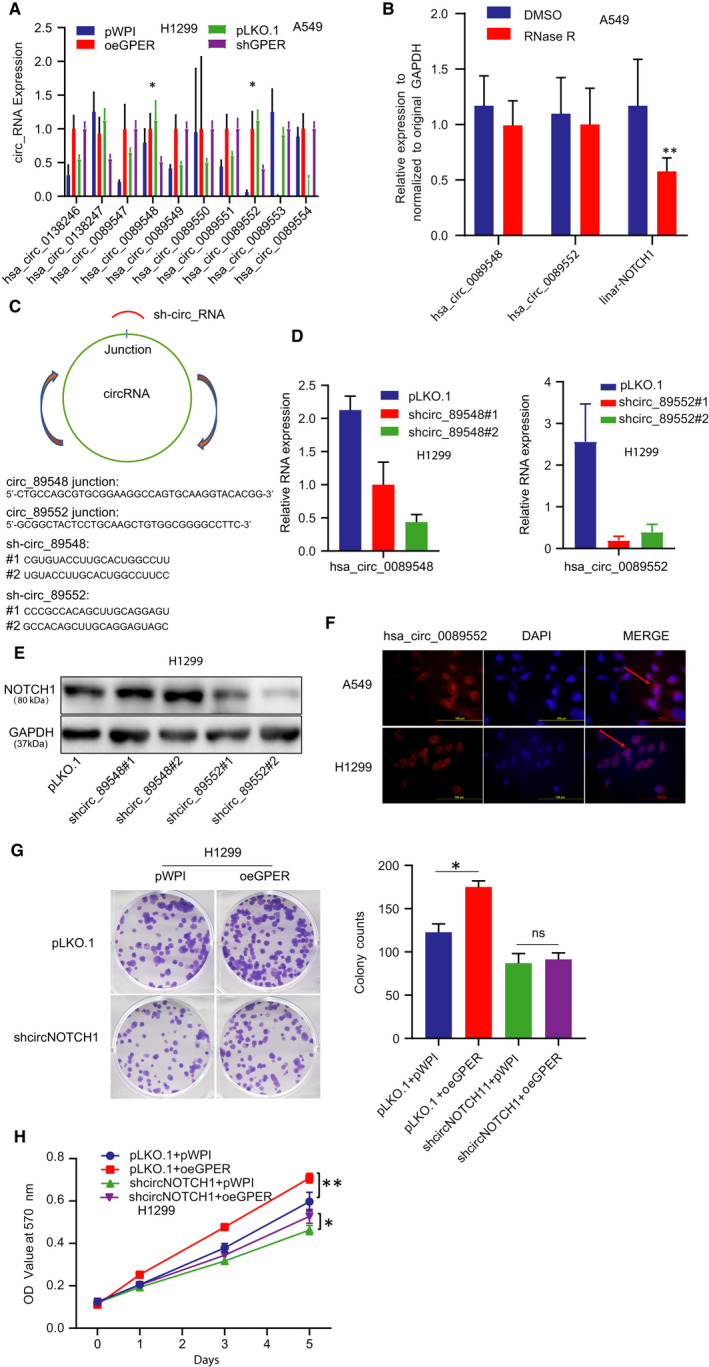
GPER functioned to positively regulate NOTCH1 expression level through circNOTCH1 in NSCLC cells. (A) We applied qRT‐qPCR to screen all the circRNAs originated from NOTCH1 gene in H1299 cells transfected with oeGPER or pWPI vector (left) and A549 cells transfected with shGPER or pLKO.1 vector (right). (B) qRT‐PCR assay was conducted to validate circRNAs expression when treated with RNase R. (C) Schematic illustration showed the principle of using shRNA to knock down the circRNAs (sh_circ_89548, sh_circ_89552). (D) qRT‐PCR assay was conducted to validate the knock‐down efficiency of circRNAs. (E) Western blot was performed to test NOTCH1 expression in H1299 cells after knocking down the two circRNAs. (F) FISH demonstrated that circNOTCH1 was predominantly localized in the cytoplasm of A549 and H1299 cells. DAPI was used to indicate the nucleus. Scale bar, 100 µm. (G) Colony formation assay was conducted to test cell growth using H1299 cells transfected as indicated: pLKO.1 + pWPI, pLKO.1 + oeGPER, shcircNOTCH1 + pWPI, shcircNOTCH1 + oeGPER, and quantification was at the right. Quantitation was presented as mean ± SD and P values calculated by t test. (H) MTT assay was conducted in H1299 cells according to the above groups. *P < .05, **P < .01