
Figure 1.
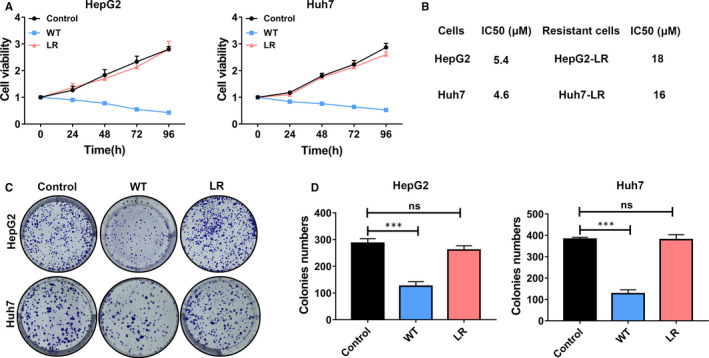
Development of lenvatinib‐resistant cell lines. A, The cell viability was measured by CCK‐8 assay at different time intervals (24, 48, 72 and 96 h) when cells were cultured with 5 μmol/L lenvatinib. The proliferation of lenvatinib‐resistant (LR) HepG2 or Huh7 cells was greater than parental HepG2 or Huh7 cells (WT). control: parental HepG2 or Huh7 cells without lenvatinib treatment; WT: parental HepG2 or Huh7 cells with lenvatinib treatment; LR: lenvatinib‐resistant HepG2 or Huh7 cells with lenvatinib treatment. B, Table with IC50 values of lenvatinib against the two developed resistant cell lines and their corresponding parental cells. C, Cells were exposed to 5 μmol/L lenvatinib in clonogenicity assay. Represent clone images of different indicated cells were shown. D, Quantification of the number of clones in different cells after treatment with 5 μmol/L lenvatinib. LR‐HepG2 or LR‐Huh7 cells formed more clones than their parental cells. ns, P value > 0.05; ***, P value < 0.001