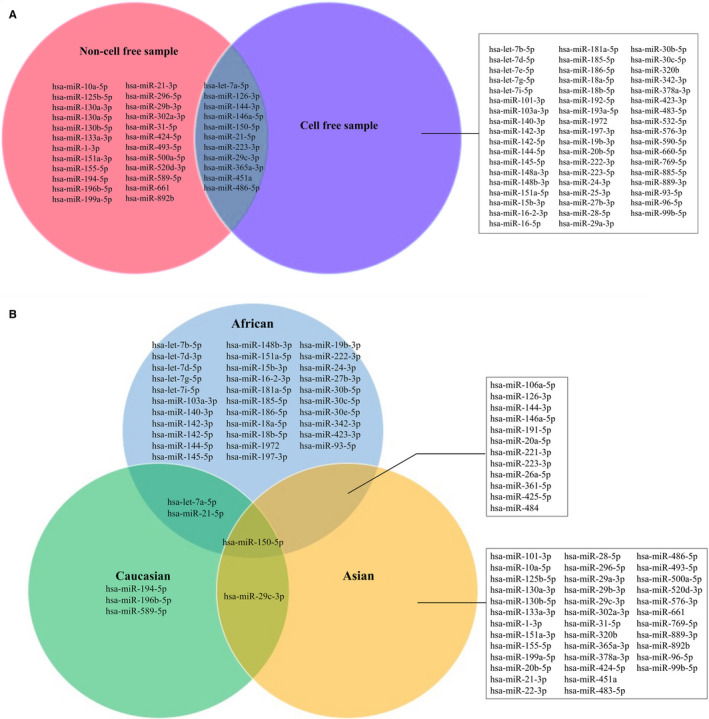
FIGURE 2.

The Venn diagram of distribution of miRNAs in included panels. A, The distribution of miRNAs in included panels which were built based on different sample types; B, The distribution of miRNAs in included panels which were built based on different ethnicities. PBMC: peripheral blood mononuclear cells; WB, whole blood
