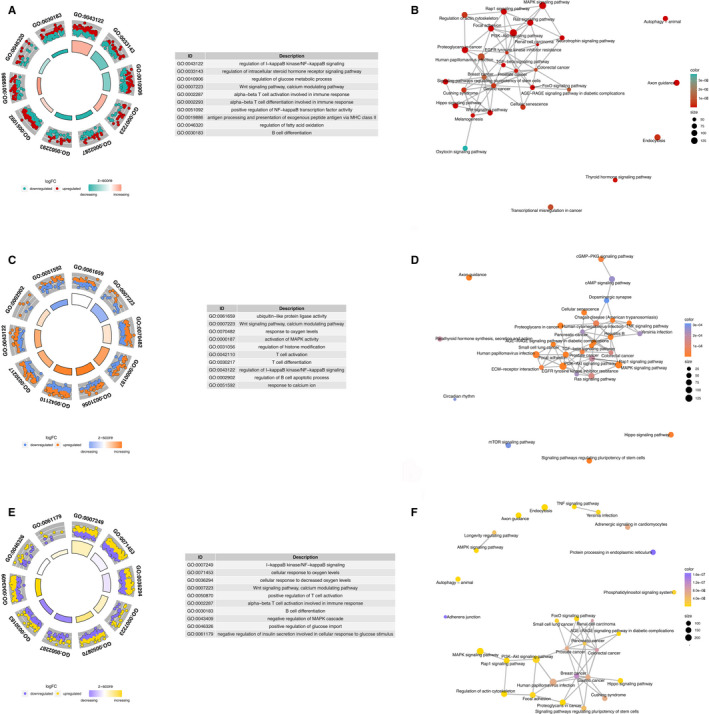
FIGURE 3.

GO and KEGG analysis of targeted genes of miRNAs in included panels based on different ethnicities (different country where study was conducted, grouped into regions). In circular plot, the inner circle shows z‐score which indicated whether the biological process is more likely to be decreased (negative value) or increased (positive value), whereas the outer circle shows the GO ID and the distribution of up and down‐regulated genes. In emapplot, each node represents a pathway of enrichment and top 30 pathways of enrichment in KEGG analysis are drawn. The node size corresponds to the number of different genes enriched under the pathway, and the colour of the node corresponds to the value of P.adjust, from small to large, corresponding to different colours. A, Circular plot of GO analysis for miRNAs in included panels which were built based on African race; B, Emapplot of KEGG analysis for targeted genes of miRNAs in included panels which were built based on African ethnicity; C, circular plot of GO analysis for targeted genes of miRNAs in included panels which were built based on Caucasian ethnicity; D, Emapplot of KEGG analysis for targeted genes of miRNAs in included panels which were built based on Caucasus; E: circular plot of GO analysis for targeted genes of miRNAs in included panels which were built based on Asian race; F, Emapplot of KEGG analysis for targeted genes of miRNAs in included panels which were built based on Asian race
