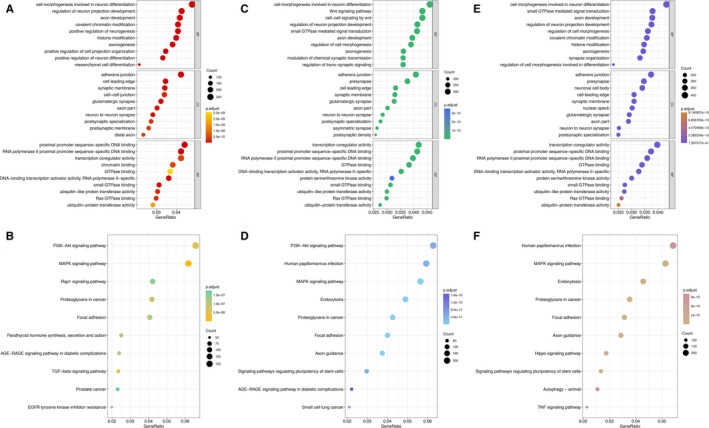
FIGURE 4.

GO and KEGG analysis of targeted genes of miRNAs in included panels based on different sample types. In dotplot, abscissa axis is GeneRatio which represents the ratio of the number of differentially expressed genes under the pathway to the total number of differentially expressed genes. The vertical axis is the description information of the enriched pathways. The top 10 pathways of enrichment are shown. The colour of the dot in the graph corresponds to the value of P.adjust. The size of the dot corresponds to the number of differently expressed genes under specific GO terms. A, Dotplot of GO analysis for targeted genes of miRNAs in both panels using non‐cell‐free samples and cell‐free samples; B, Dotplot of KEGG analysis for targeted genes of miRNAs in both panels using non‐cell‐free samples and cell‐free samples; C, Dotplot of GO analysis for targeted genes of miRNAs in included panels using non‐cell‐free samples; D, Dotplot of KEGG analysis for targeted genes of miRNAs in included panels using non‐cell‐free samples; E, Dotplot of GO analysis for targeted genes of miRNAs in included panels using cell‐free samples; F, Dotplot of KEGG analysis for targeted genes of miRNAs in included panels using cell‐free samples. BP, biological process; CC, cellular component; MF, molecular function
