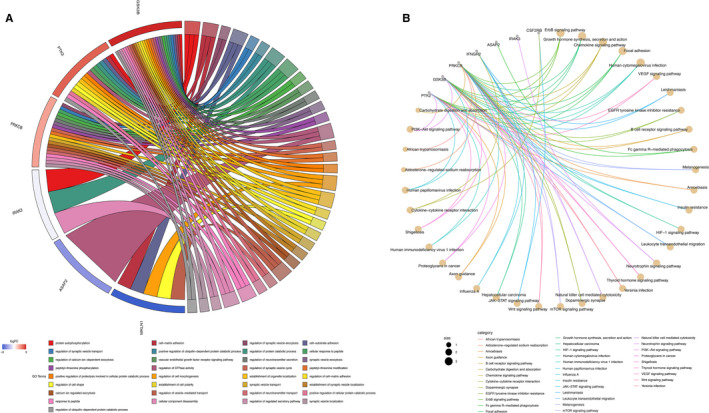
FIGURE 5.

GO and KEGG analysis of parental genes of circRNAs in included panels. In chord plot, up‐ or down‐regulated genes are shown in the left side, whereas GO terms are listed on the right side. The ribbons represent a certain gene in a certain GO term, and the thickness of the ribbons is proportional to the number of parental genes. In cnetplot, the grey dots represent parental genes and the yellow dots represent enriched pathways. The top 35 enriched pathway in KEGG analysis was shown. The size of pathways nodes corresponds to the number of genes enriched. A, The chord plot of GO analysis for parental genes of circRNAs in included panels; B, The cnetplot of KEGG analysis for parental genes of circRNAs in included panels
