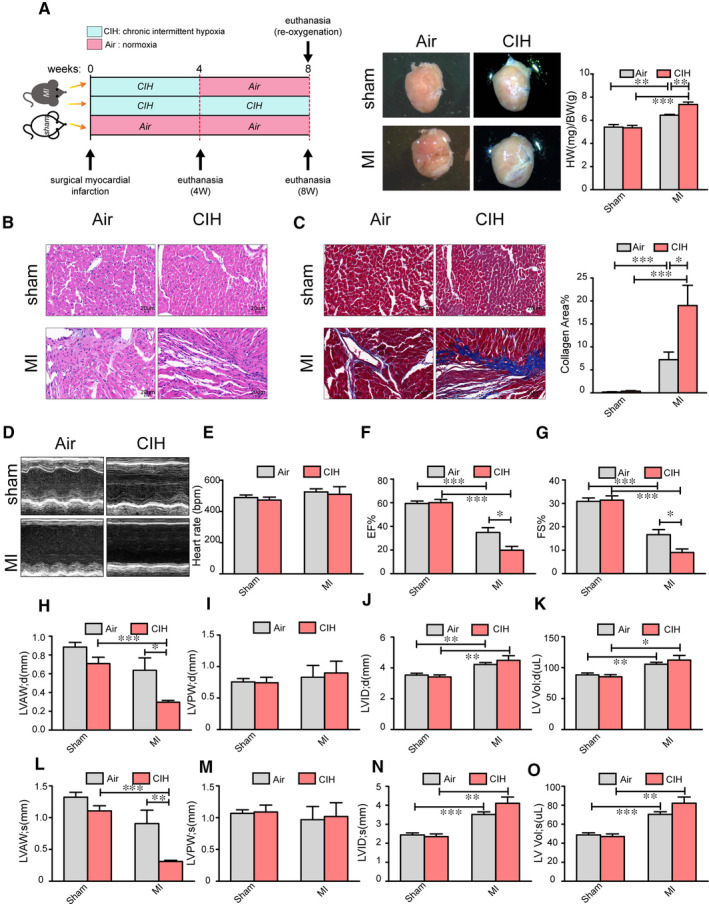
Figure 1.

CIH modulates cardiac injury post‐infarction. A, Experimental scheme for establishing the mouse model. A representative whole heart image for the quantification of cardiac hypertrophy burden. HW/BW indicates the heart weight/bodyweight. n = 11 for Sham + Air, n = 10 for Sham + CIH, n = 7 for MI + Air and n = 8 for MI + CIH. B and C, Cross sections of heart tissues were stained by HE and Masson, respectively, and cardiomyocyte inflammation and cardiac fibrosis were determined. n = 6 for each group. D, Cardiac function was examined by echocardiography, and representative left ventricular M‐mode echocardiography images are shown. E‐O, Quantification of heart rate, EF, FS, LVAWd (left ventricular diastolic anterior wall), LVAWs (left ventricular systolic anterior wall), LVPWd (left ventricular diastolic posterior wall), LVPWs (left ventricular systolic posterior wall), LVIDd (left ventricular internal diastolic diameter), LVIDs (left ventricular internal systolic diameter), LV Vol‐d (left ventricular diastolic volume) and LV Vol‐s (left ventricular systolic volume). Air indicates normoxia. n = 8 for Sham + Air, n = 7 for Sham + CIH, n = 6 for MI + Air and n = 8 for MI + CIH. *P < .05, **P < .01, ***P < .001. Data are presented as mean ± SEM
