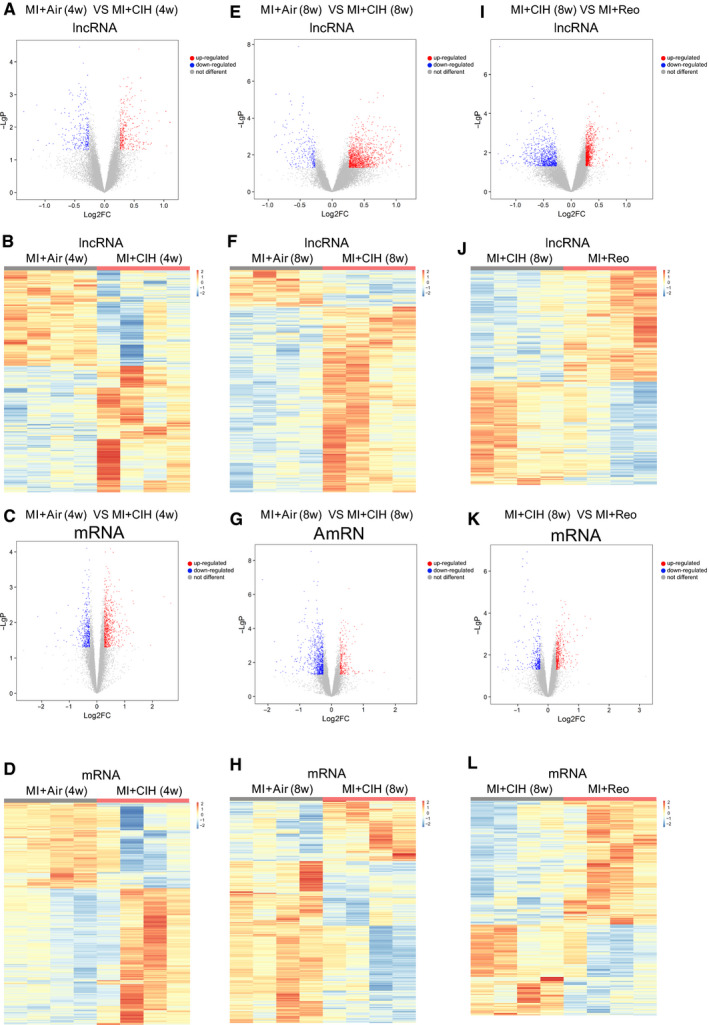
Figure 2.

Specific lncRNAs and mRNAs regulated by CIH and reoxygenation under MI. A and C, Volcano plots showing the lncRNAs and mRNAs significantly regulated by 4‐week exposure to CIH. The lncRNAs and mRNAs with P ≤ .05 (t test) and fold change in expression ≥ 1.2 were regarded as differentially expressed between the groups. B and D, Heat map depicting the changes in lncRNAs and mRNAs in MI mice after exposure to CIH for 4 wk. E and G, Volcano plots of the significantly different lncRNAs and mRNAs between MI and MI + CIH group at 8 wk. F and H, Heat map of the relative abundance of significantly changed lncRNAs and mRNAs by CIH at 8 wk. I and K, The lncRNAs and mRNAs that varied between MI complicated with CIH (8 wk) and MI with reoxygenation (4 wk) after CIH (4 wk) are shown in the volcano plots. J and L, The relative abundance of lncRNAs and mRNAs in I and K is shown in the heat map. Air indicates normoxia; Reo indicates reoxygenation after CIH; 4W indicates 4 wk; and 8W indicates 8 wk. The red scatters in volcano plots indicate genes up‐regulated by CIH, blue scatters indicate genes down‐regulated, and grey scatters indicate genes that are not different between the groups. The heat map scale indicates the relative abundance of specific genes that were transformed into Z scores. The value of (−log P) was the base 10e negative logarithm of the P‐value. n = 4/group
