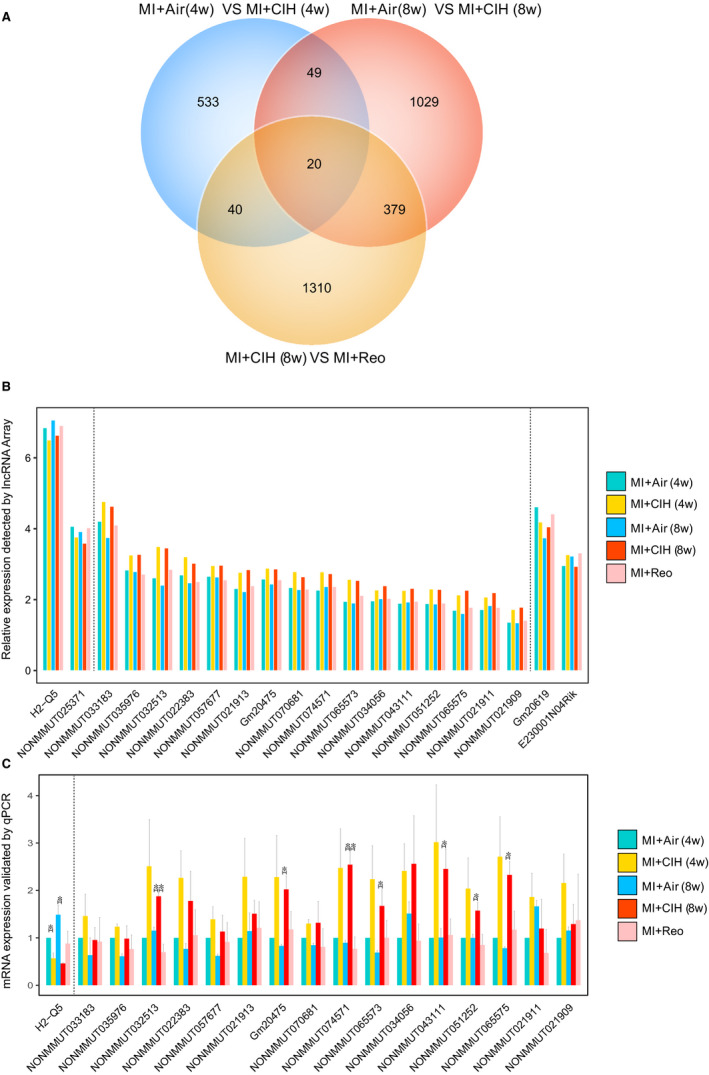
Figure 3.

lncRNAs responsive to CIH post‐infarction. A, Venn diagram showing the number of lncRNAs that are statistically altered by 4 and 8 wk of CIH post‐MI, as well as the lncRNAs regulated by reoxygenation (4 wk) after CIH (4 wk). B, The relative abundance of the 20 overlapping lncRNAs detected by Venn diagram in lncRNA array. n = 4 for each group. C, The expression of 17 out of the 20 overlapping lncRNAs was validated by qPCR analysis. Murine GAPDH gene was used as the housekeeping internal control. The transcript expression was quantified relative to the expression level of GAPDH using the comparative cycle threshold (ΔCt) method. Air indicates normoxia; Reo indicates reoxygenation after CIH; 4W indicates 4 wk; and 8W indicates 8 wk. n = 3/group. *P < .05. Data are presented as mean ± SEM
