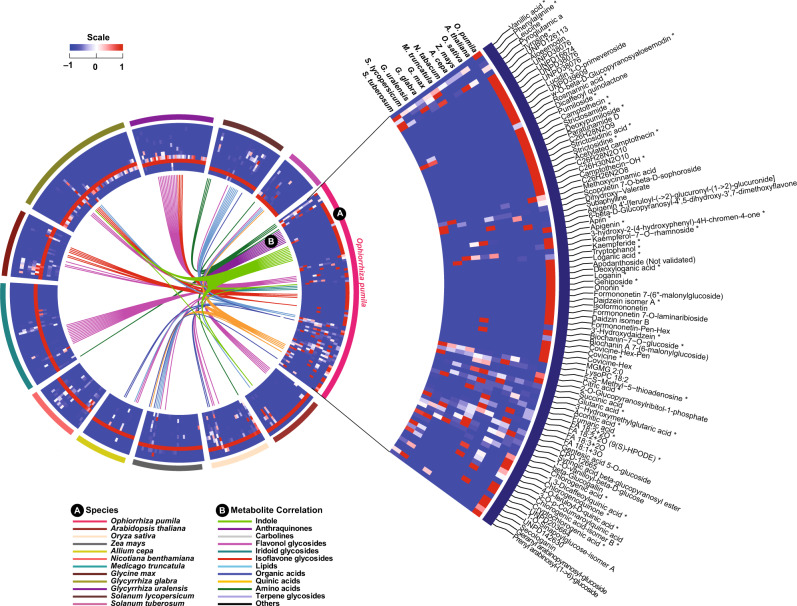
Fig. 4. Ophiorrhiza pumila metabolome, assigned using 13C and 15N stable isotope labeling, compared with metabo-space of 11 plant species.
Circuit A shows plant species used to compare metabolome space with that of O. pumila, and circuit B shows the connections between metabolite features, and are based on metabolite network relationships defined by a correlation coefficient >0.85. Highly accumulated metabolites across 12 plant species and their relationships in the form of metabo-ontology and scaled accumulation levels as a heat map are shown here. Metabolites were filtered (log10 intensity > 3.9) and assigned to the O. pumila category. If a metabolite was not detected in O. pumila, then it was assigned to the plant category with the highest accumulation compared to the rest of the plant species. *Indicates chemically assigned metabolites based on pure standards or MS/MS analysis using public databases. Source data are provided as a Source data file.

