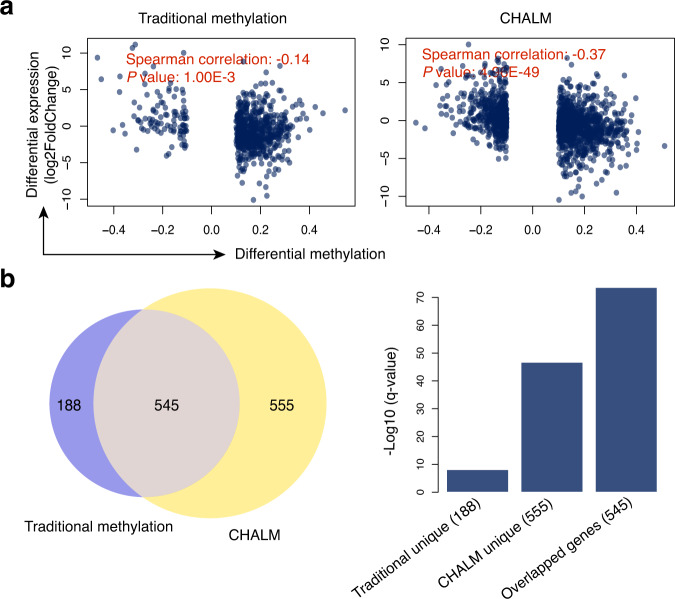
Fig. 4. CHALM better identifies hypermethylated promoter CGIs during tumorigenesis.
a Scatter plots show the correlation between differential expression and differential methylation calculated by the traditional and CHALM methods. All promoter CGIs were included for analysis, but only those exhibiting a significant methylation change between normal and cancerous lung tissue were plotted. X-axis: differential methylation ratio; y-axis: differential expression (log2FoldChange). Comparison of correlation (between the traditional method and CHALM) permutation P values: <1 × 10⁻⁴. b A large fraction of hypermethylated promoter CGIs identified by the traditional method can be recovered using the CHALM method, as indicated by the Venn diagram. Bar plot shows enrichment of the H3K27me3 peak in three different gene sets.

