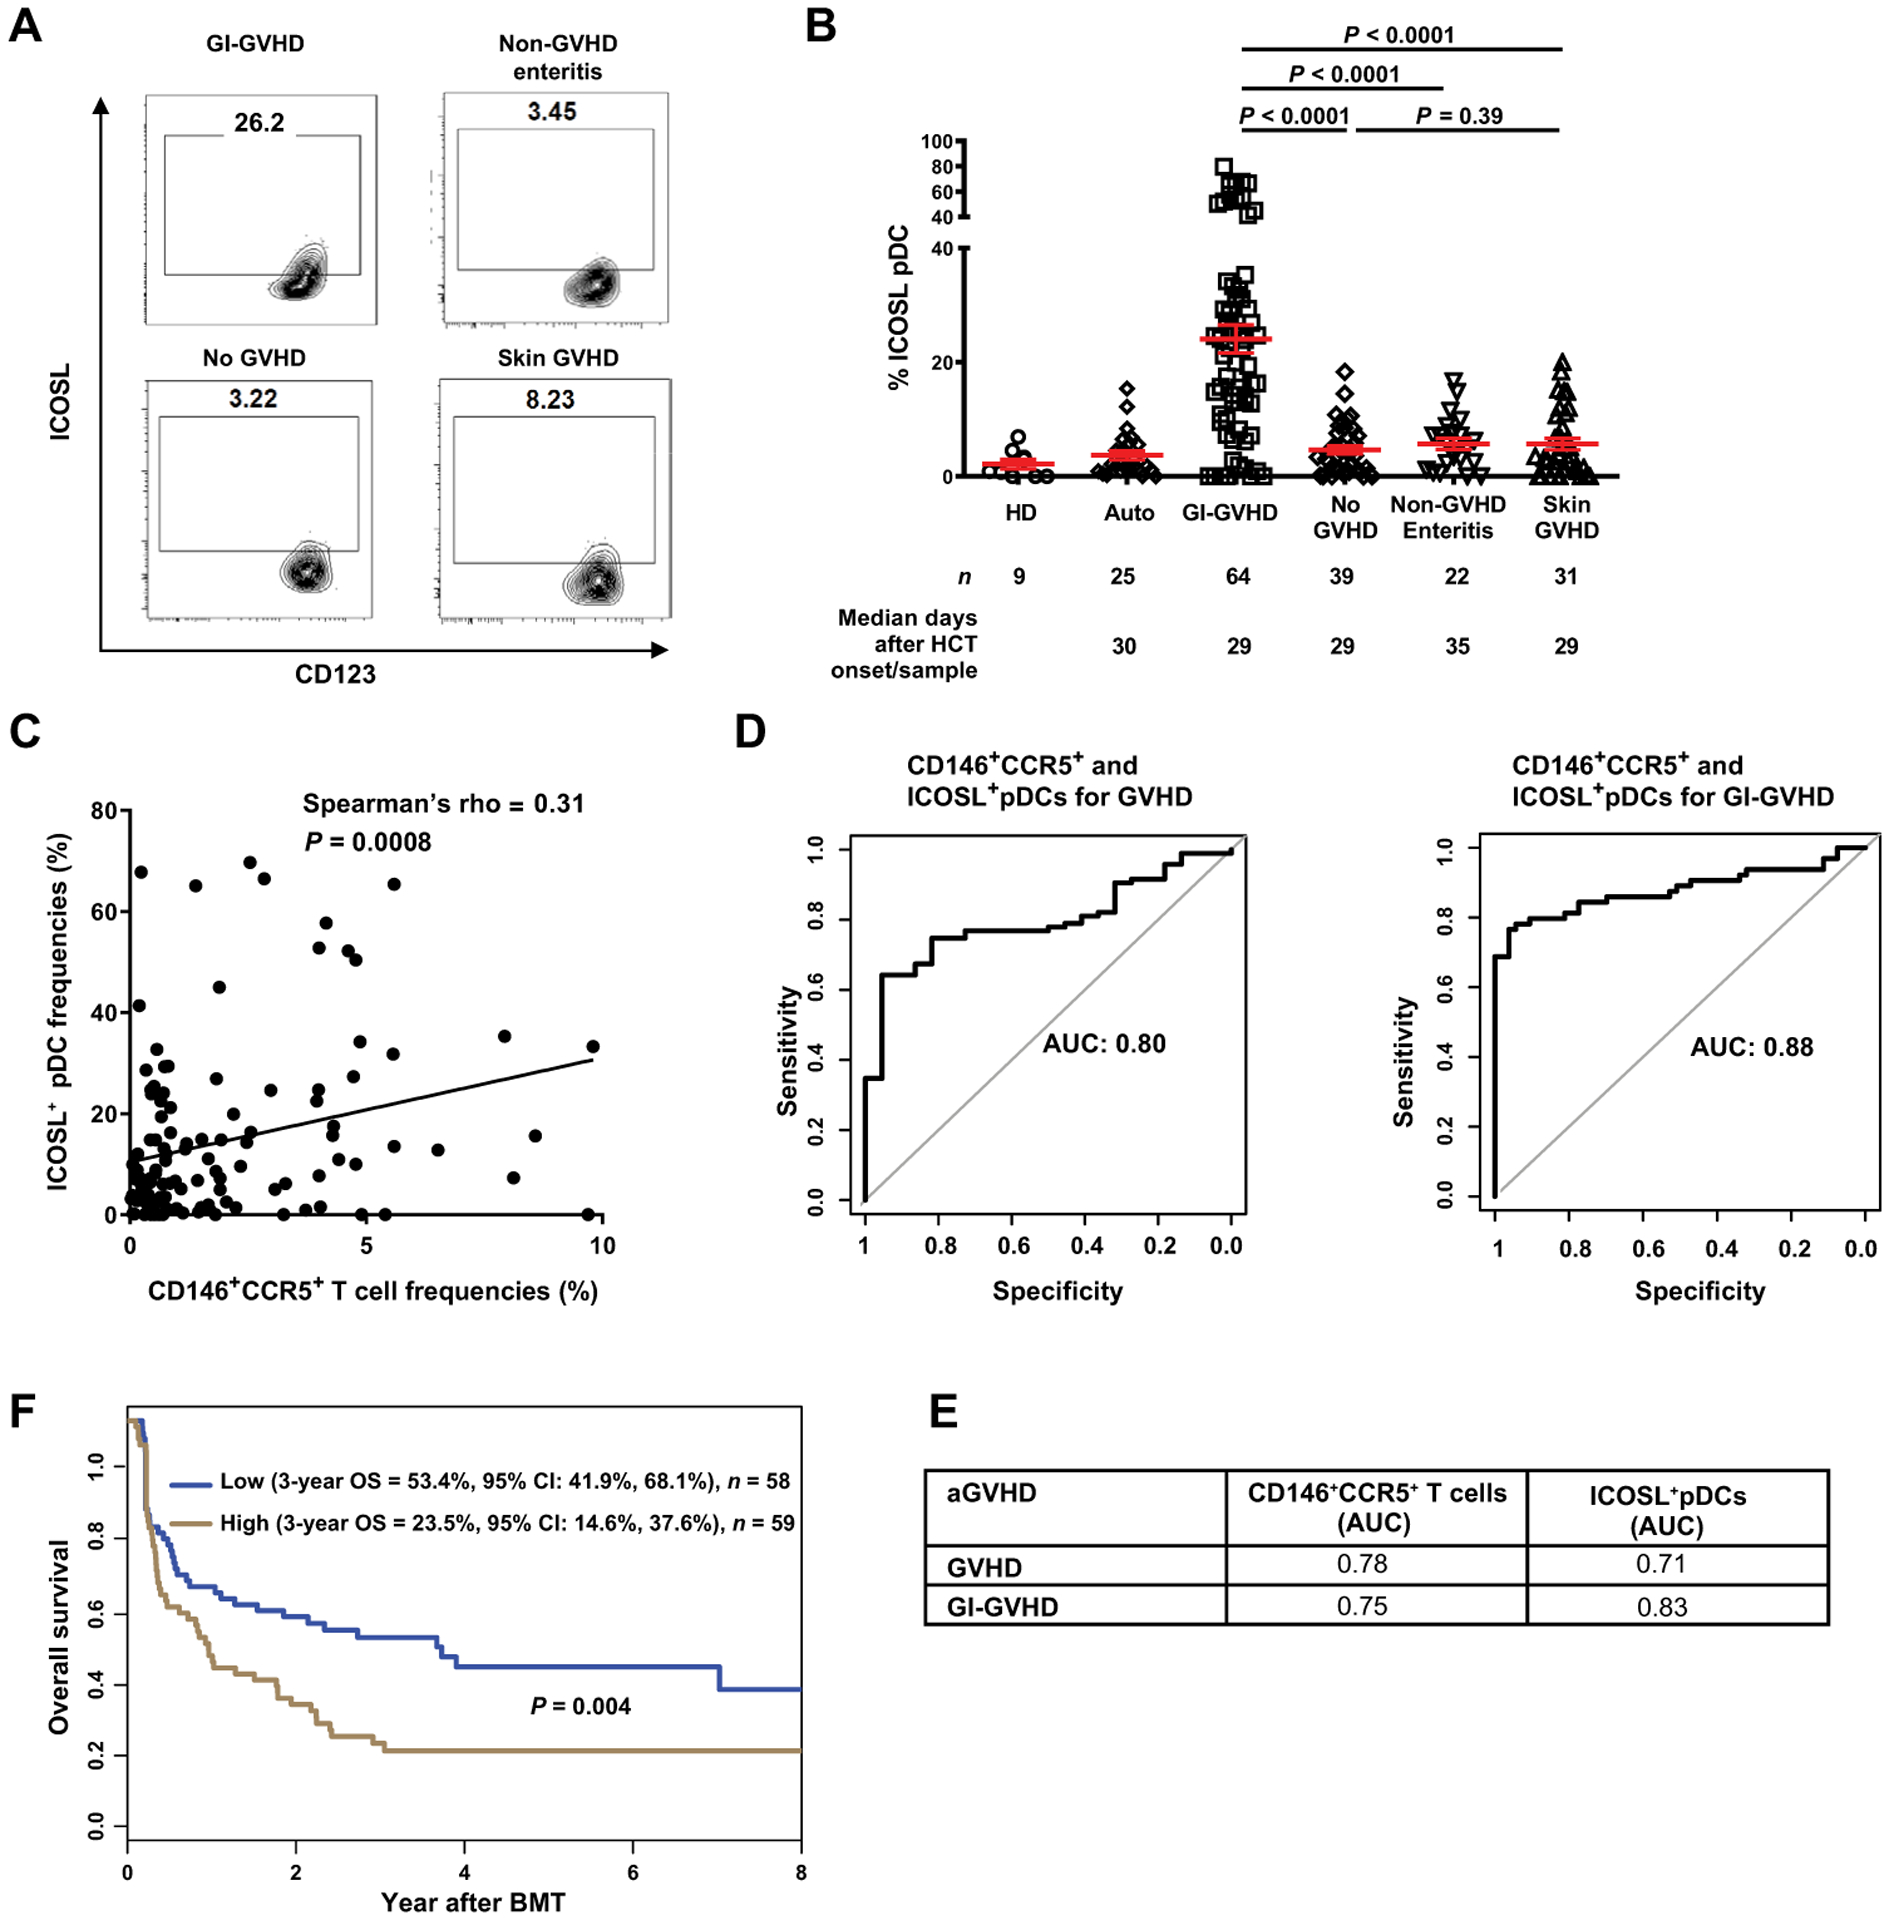
Fig. 1. ICOSL+ pDCs in patients after allogeneic HCT.

(A) Representative plots showing percentage of cells positive for ICOSL and CD123 in samples from patients without GVHD or with GI-GVHD, non-GVHD enteritis, or skin GVHD. (B) ICOSL+CD123+CD11c−HLA-DR+Lin− pDC frequencies in healthy donors (HDs) and in autologous transplant (Auto) or allogeneic patients. Number of patients (n) and median days after HCT onset of signs/sample collection are shown below the graphs. The data are shown as mean ± SEM, unpaired t test. (C) The correlation between ICOSL+CD123+CD11c−HLA-DR+Lin− pDCs and CD146+CCR5+CD4+ T cells frequencies in patients with GVHD (n = 95) and non-GVHD enteritis (n = 22) (total n = 117) using Spearman’s correlation. (D) Receiver operating characteristic curves of ICOSL+ pDCs and CD146+CCR5+ T cells in GVHD and GI-GVHD. (E) AUCs calculated from the curves in fig. S5 (B to E). (F) Three-year overall survival (OS) in allogeneic HCT patients with symptoms [GI-GVHD (n = 64), non-GVHD enteritis (n = 22), and skin GVHD (n = 31)] divided by low and high ICOSL+ pDC frequencies. High-risk group is shown in brown (ICOSL+ pDC frequency ≥ 8.23%, n = 59); the low-risk group is shown in blue (n = 58). Statistical significance was calculated for the overall curve by log-rank test. CI, confidence interval.
