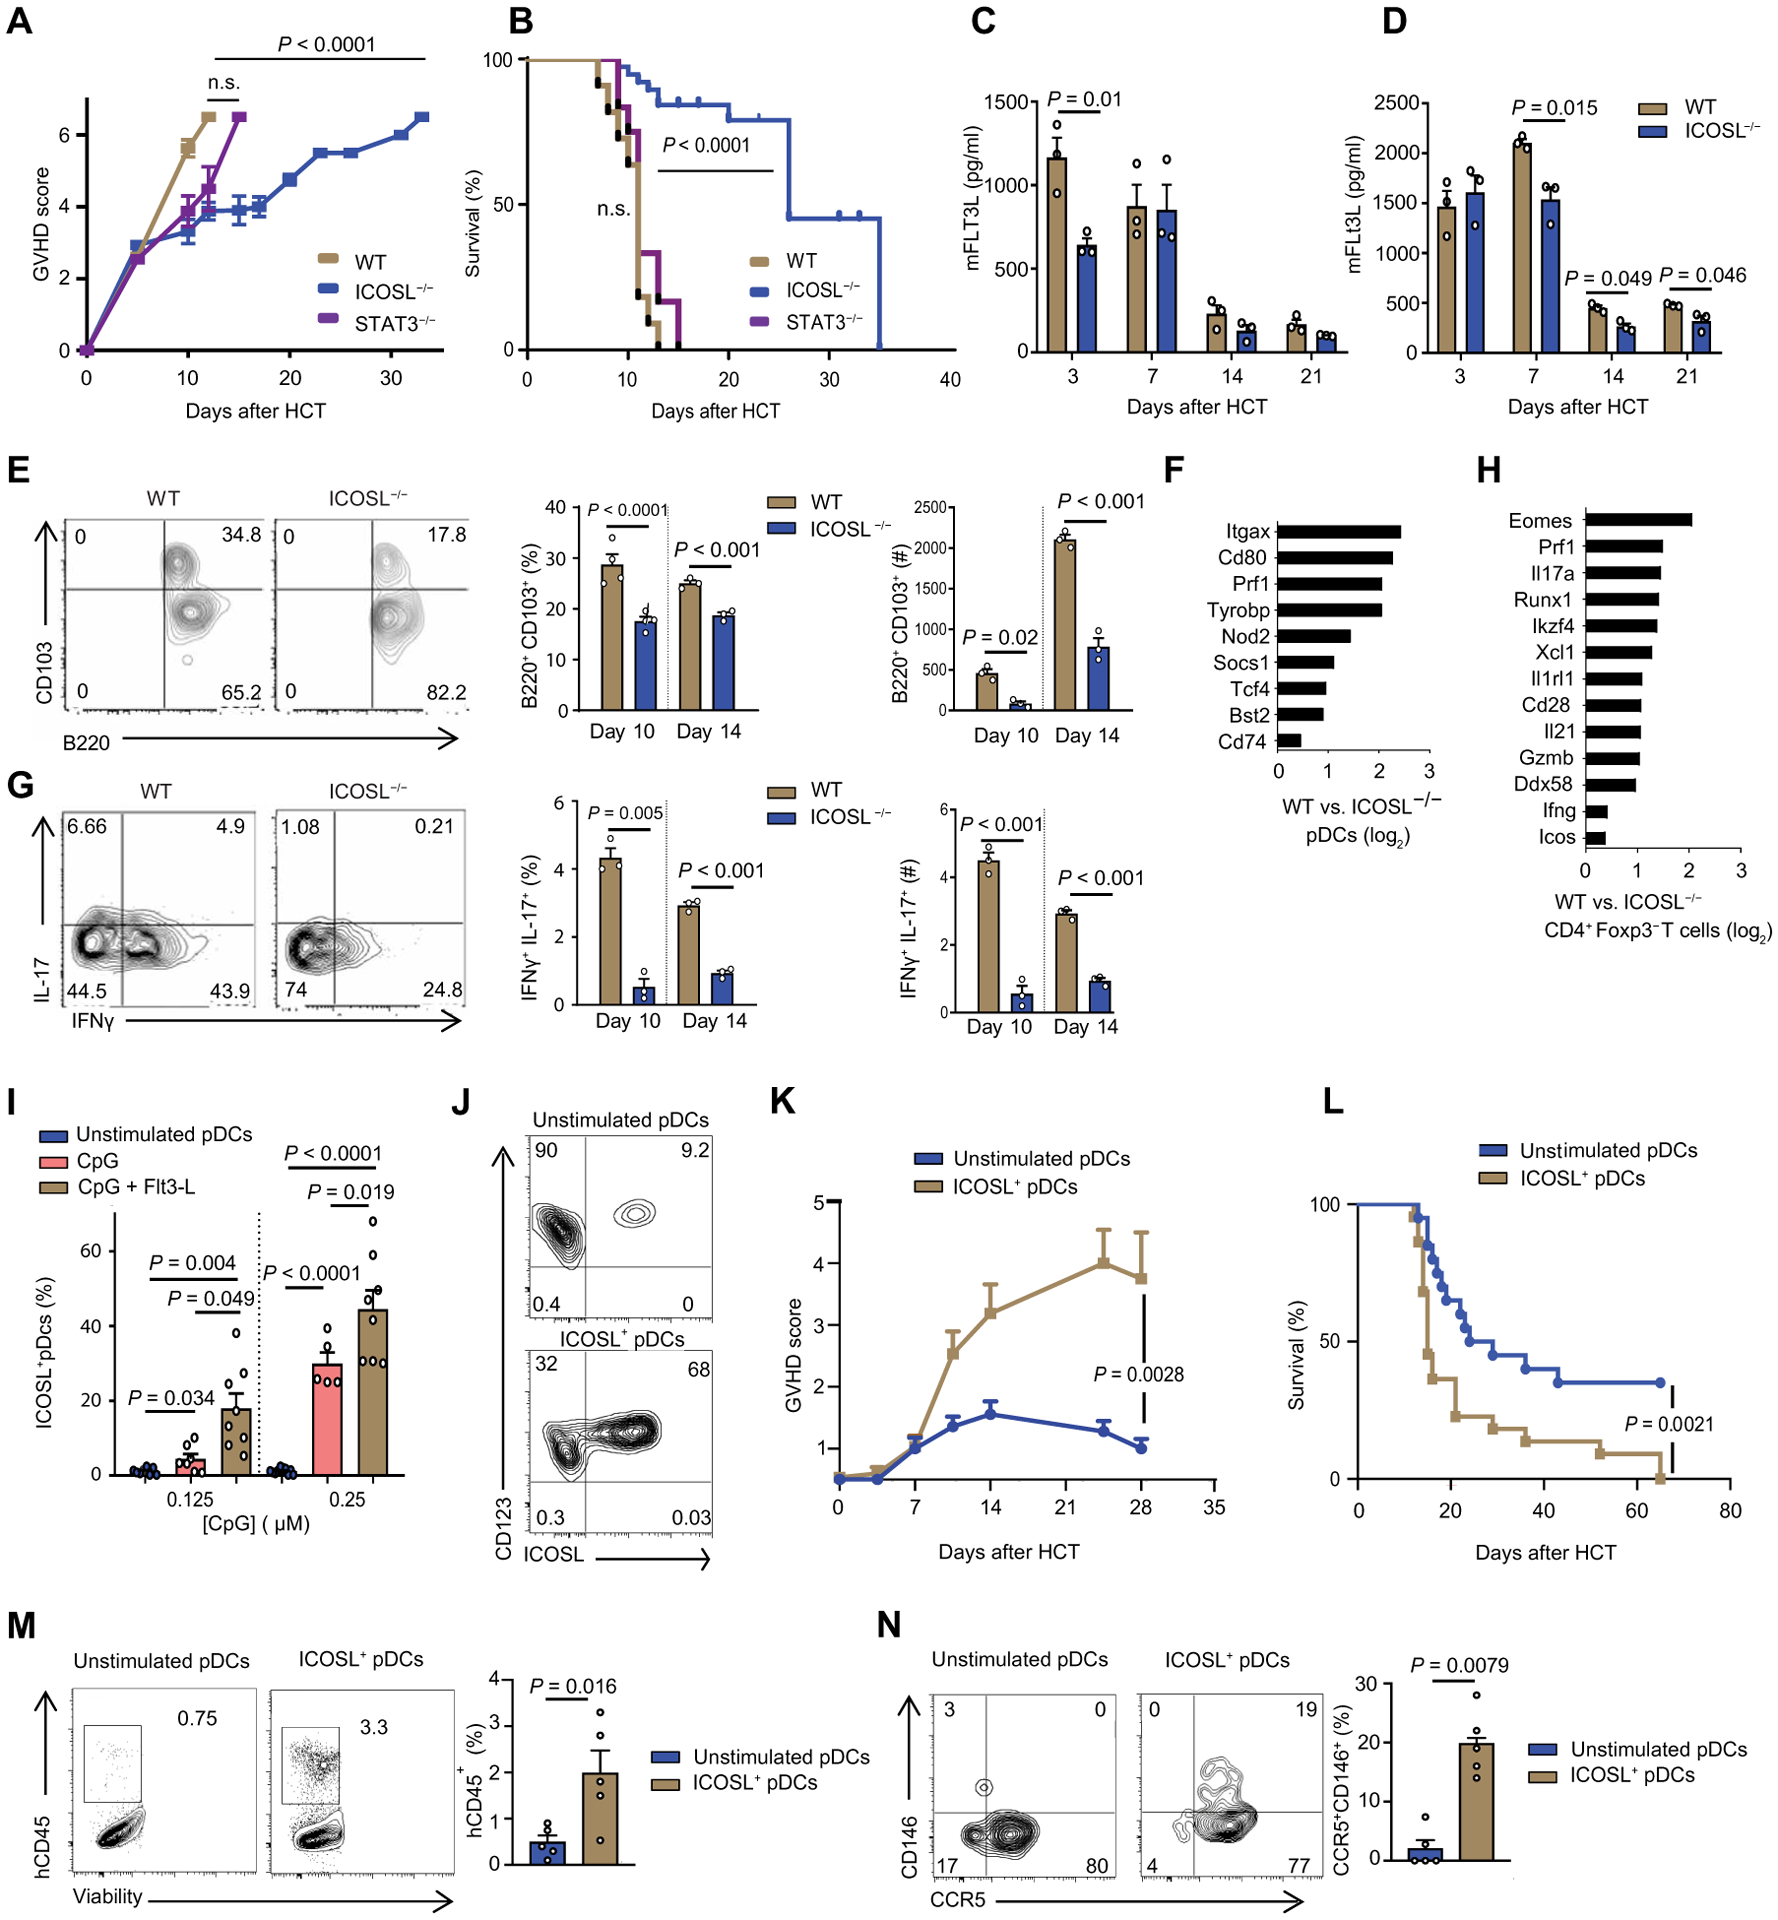
Fig. 2. aGVHD severity and mortality in ICOSL−/− BM and ICOSL+ pDCs recipients in both a major mismatch murine model and a human PBMC-NSG GVHD model.

(A and B) Clinical GVHD score (A) and survival curve (B): B6 wild-type (WT) (n = 15), B6 ICOSL−/− (n = 15), or B6 CD11cCreSTAT3fl/fl (n = 15). BALB/c mice were irradiated with 900 cGy and then injected intravenously with 1 × 10⁶ of WT B6 T cells and 5 × 10⁶ of BM from WT, ICOSL−/−, or CD11cCreSTAT3fl/fl B6 mice for allogeneic transplant. n.s., not significant. (C) Kinetics of serum concentrations of murine FLT3L in BALB/c recipient mice at the indicated days after allogeneic HCT WT or ICOSL−/− BM into BALB/c (n = 3 each group). (D) Kinetics of serum concentrations of murine FLT3L in the haploidentical model (WT or ICOSL−/− B6 ➔ BALB/c) at the indicated days after allogeneic HCT (n = 3 each group). (E) CD11b−CD11c+CD103+B220+ pDCs from the gut of recipient mice injected with WT or ICOSL−/− BM analyzed at days 10 and 14 after HCT (n = 3). Representative flow cytometry and percent positive and absolute number of cells are shown. (F) Transcriptome analysis comparing sorted intestinal pDCs from recipient mice injected with WT or ICOSL−/− BM at day 10 after HCT. Data are shown as ratio of fold change between sorted WT and ICOSL−/− pDCs log2-transformed. (G) Representative plots of Th17 positive for IL-17 or IFNγ or both in the gut of mice that received WT or ICOSL−/− BM, analyzed at day 10 after HCT (n = 3). Representative flow cytometry and percent double positive and absolute number of cells are shown. (H) Transcriptome analysis comparing sorted intestinal CD4+ Foxp3− T cells from WT and ICOSL−/− BM recipient B6 mice at day 10 after HCT. Data are shown as ratio of fold change between sorted WT and ICOSL−/− CD4+ T cells log2-transformed. (I) Percentage of human pDCs positive for ICOSL after stimulation with 0.125 and 0.25 μM CpG or with Flt3-L (200 ng/ml) overnight. pDCs were enriched from human PBMCs. (J) Representative flow cytometry for the experiment in (I), showing percentage of human pDCs positive for ICOSL. Cells were either unstimulated or exposed to both CpG (0.25 μM) and Ftl3-L (200 ng/ml) overnight. (K to N) GVHD score (K), survival (L), intestinal hCD45 infiltration (M), and intestinal CD146+CCR5+ T cells (N) in NSG mice receiving 50,000 of stimulated or unstimulated pDCs with 5 × 10⁶ PMBCs depleted of pDCs (n = 10). In (A), (C) to (E), (G), (I), (K), (M), and (N), data are shown as mean ± SEM. In (C) to (E), (G), and (K) to (N), statistical significance was determined by unpaired t test; in (A) and (I), by ANOVA with Bonferroni’s correction; in (B) and (L), by Mantel-Cox log-rank test.
