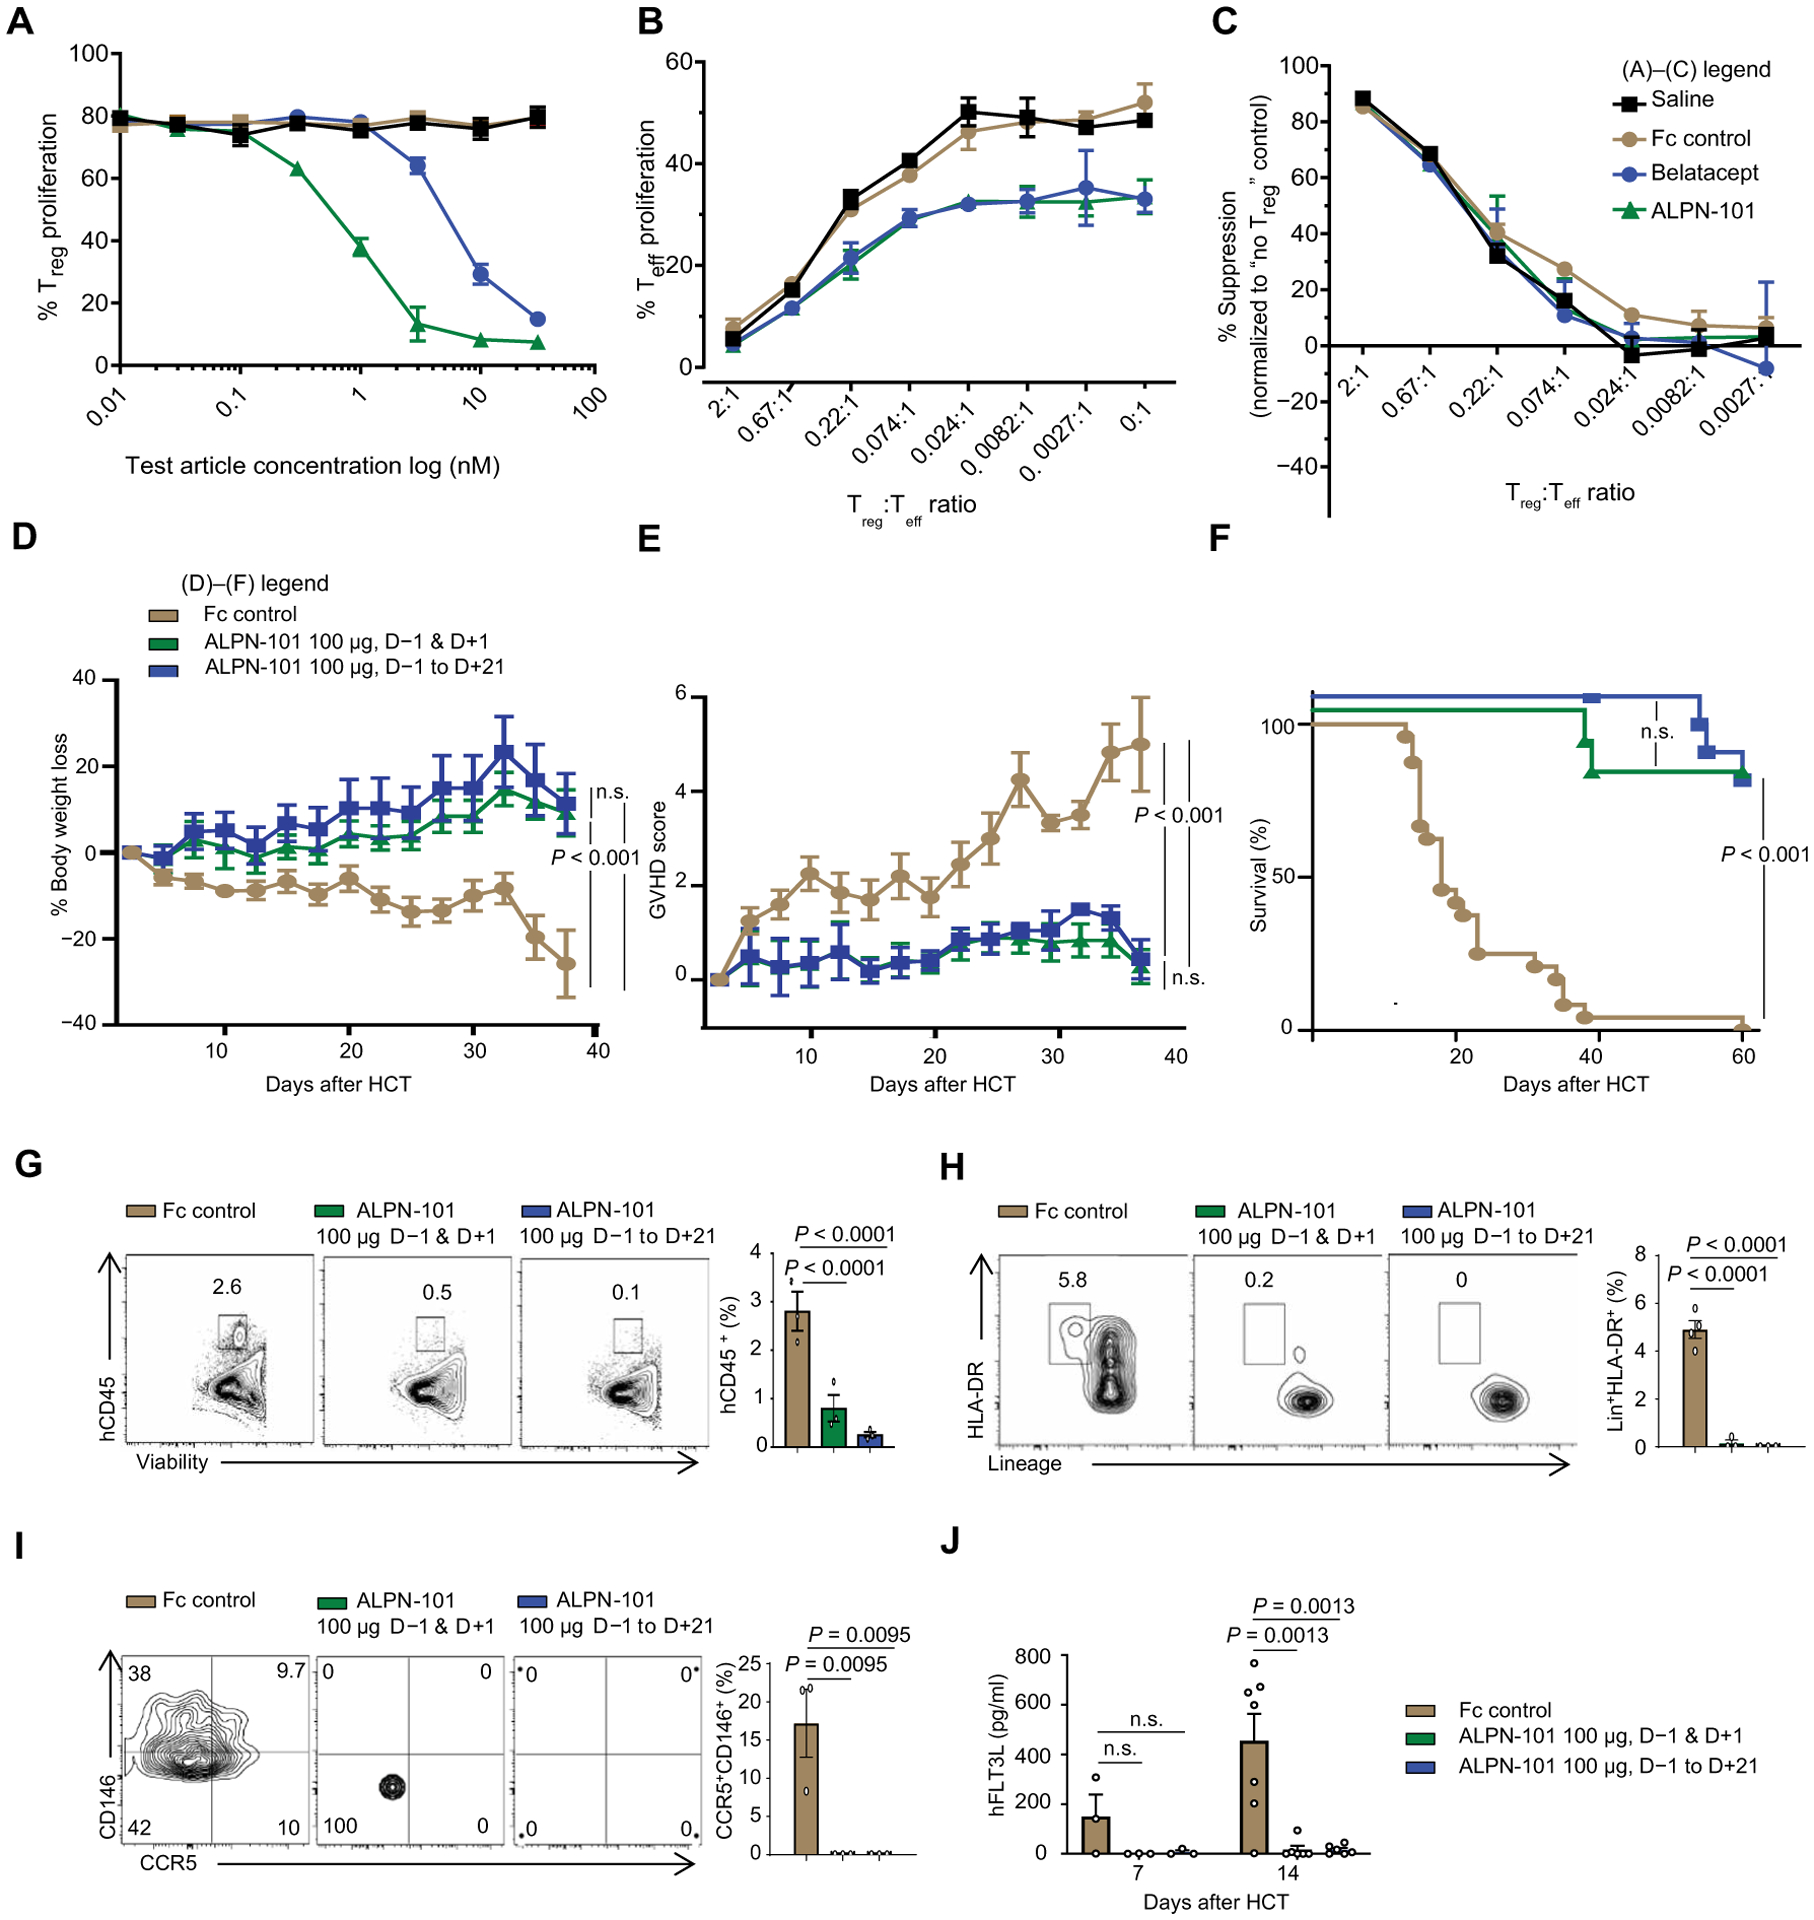
Fig. 5. Impact of ALPN-101 on Teff and Treg proliferation and on huDCs and huCD4+CD146+CCR5+ T cell populations in target organs.

(A to C) Effect of ALPN-101 on T cell proliferation. Human Teffs and Tregs were stained with antibodies recognizing FoxP3, CD4, PD-1, CD25, CD28, CD127, ICOS, PD-L1, and Helios to confirm their surface phenotype before culture. In (A), enriched Tregs were labeled with CellTrace Violet (CTV) and cultured with soluble anti-CD3 antibody, recombinant IL-2 (rIL-2), and K562 APCs (transfected with CD80 and treated with mitomycin C) in medium with saline (black) or with various concentrations of the test molecules: Fc control (brown), belatacept (blue), or ALPN-101 (green). (A) After 3 days, Treg proliferation was assessed by CTV dilution by flow cytometry. Statistical differences between Fc control and the other test molecules were determined by an unpaired t test. The ALPN-101 treatment effect is significantly different from the Fc control group (P = 0.0037 at 1 nM, P = 0.0034 at 3 nM, and P = 0.0003 at 30 nM by unpaired t test) and also significantly different from the belatacept group (P = 0.004 at 1 nM and P = 0.007 at 3 nM). (B) Tregs labeled with CTV were mixed at the indicated ratios with Teff labeled with CFSE and cultured with mitomycin C–treated, CD80low K562 APCs, and soluble anti-CD3 antibody in medium containing added saline or 30 nM of each test molecule. After 4 days, Teff proliferation was assessed by CFSE dilution by flow cytometry. The ALPN-101 treatment effect is significantly different from the Fc control group at all Treg:Teff ratios except 2:1 (P = 0.0001 at 0.67:1; P = 0.0345 at 0.22:1; P = 0.0158 at 0.074:1; P = 0.0313 at 0.024:1; P = 0.0196 at 0.0082:1, P = 0.0187 at 0.0027:1, and P = 0.0342 at 0:1, by unpaired t test). (C) Specific Treg suppression activity for each culture condition was determined (see Materials and Methods). Concentrations are the same as in (B). Data are presented normalized to Teff activity in the absence of Tregs. (D to F) Effect of ALPN-101 on health [BW (D) and GVHD severity score (E)] and survival (F) of the human PBMC-NSG GVHD model. NSG mice were irradiated at 300 cGy at day −1 and then transplanted with 3.5 × 10⁶ human PBMCs at day +1. Mice were treated every other day with Fc control (brown) or 100 μg of ALPN-101 from days −1 to +21 (12 doses total; blue) or 100 μg of ALPN-101 on days −1 and +1 (2 doses total; green). n = 10 mice in all groups. (G to I) Human hematopoietic cell engraftment (G), Lin−HLA-DR+ total DCs (H), and CD4+CD146+CCR5+ T cells (I) in the GI tract of NSG recipient mice. Five mice from (D) to (F) were analyzed at day 14 after HCT comparing Fc control and ALPN-101–treated groups. (J) Concentration of human FLT3L in plasma from NSG mice from (D) to (F) at days 7 and 14 after HCT (n = 3 mice per time point). Data are shown as mean ± SEM, except for survival curves and representative flow cytometry. In (A) to (C), statistical significance was determined by unpaired t test, and in (D), (E), and (G) to (J), it was determined by ANOVA with Bonferroni’s correction. Log-rank test (Mantel-Cox) was used for survival analysis in (F).
