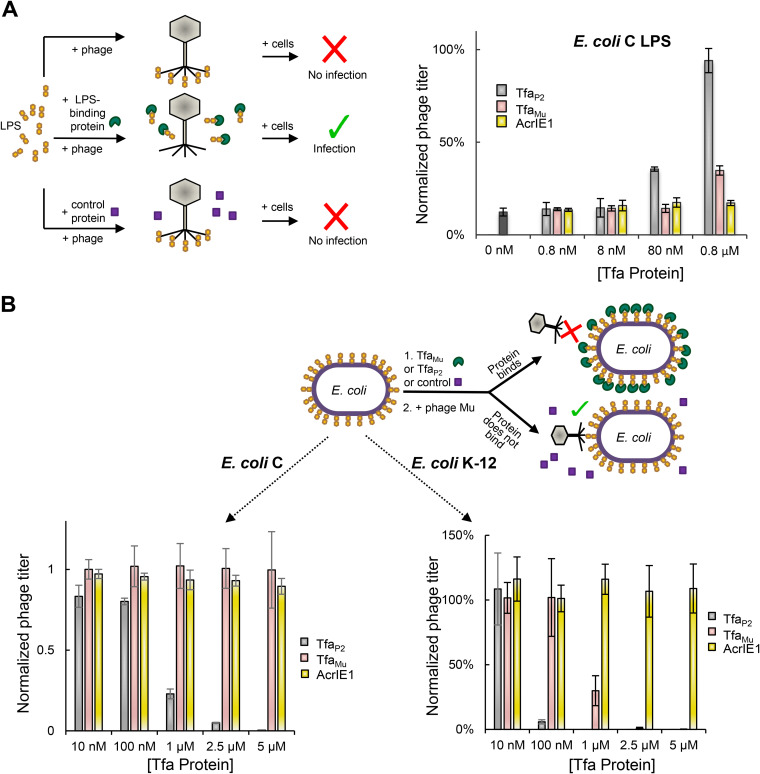
FIG 2.
TfaMu and TfaP2 show distinct LPS-binding specificities. (A) As illustrated by the diagram on the left, a P2 phage lysate was added to 50 μg of E. coli C LPS alone or LPS premixed for 1 h with increasing amounts of TfaMu, Tfa P2, or control protein (AcrIE1). After a further 1-h incubation, the number of infective particles was determined by plaquing assays. The phage titer was normalized to an untreated lysate. (B) As illustrated by the diagram, E. coli C cells (left graph) or E. coli K-12 cells (right graph) were mixed for 1 h with increasing amounts of TfaMu, Tfa P2, or control protein (AcrIE1). The cells were then mixed with a lysate of phage P2 and plated. The number of resulting plaques was normalized to that obtained on cells that were not premixed with protein. The data shown for TfaMu in Fig. 1B are also shown here in the right graph for the purpose of comparison. The values shown are the mean of three replicates with error bars representing the standard deviation. The actual reduction in PFU under conditions of maximal inhibition by Tfa proteins or LPS was approximately 300-fold.

