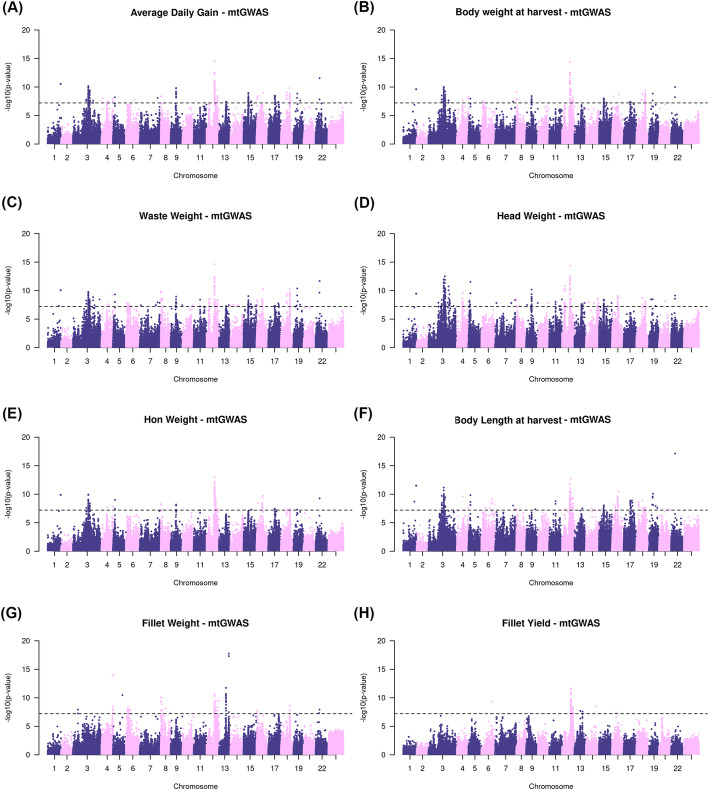
Fig. 2.
Manhattan plot for multi-trait GWAS (mtGWAS) for eight body traits in Nile tilapia. Manhattan plots of SNPs associated with: a Average daily gain. b Body weight at harvest. c Waste weight. d Head weight. e Gutted head-on weight. f Body length at harvest. g Fillet weight. h Fillet yield. The x-axis presents genomic coordinates along chromosomes 1–23 in Nile tilapia. On the y-axis the negative logarithm of the SNPs associated p-value is displayed. The dashed black line represents the genome-wide significance threshold after Bonferroni correction (−log10 (p-value > 7.21e-8)

