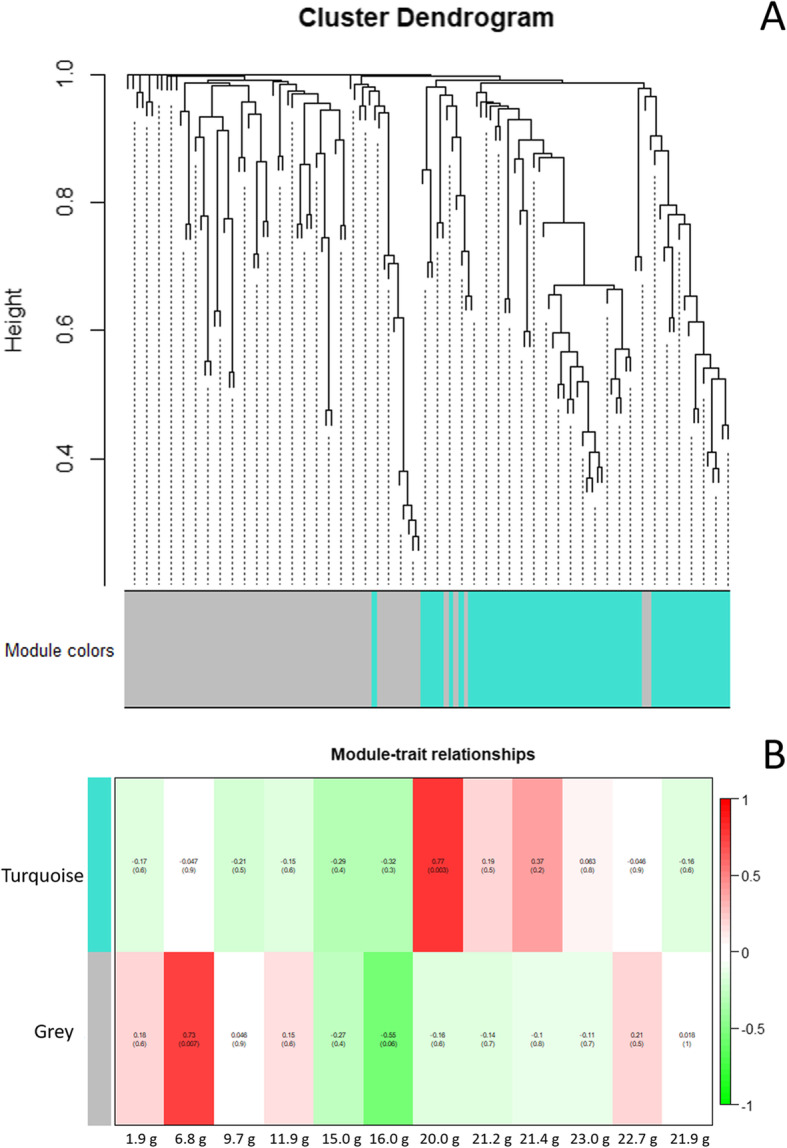
Fig. 7.

Hierarchical cluster tree with dissimilarity based on topological overlap showing coexpression modules identified by weighted gene co-expression network analysis (a). Each leaf in the tree shows one AeNAC gene. The branches constitute two modules labeled by turquoise and grey colors, respectively. b, Module-developmental stages association. The color of each block indicates the correlation coefficient between the module and the different developmental stages. The correlation coefficient R (upper) and P-value (lower) in each block are indicated by upper number and lower number, respectively
