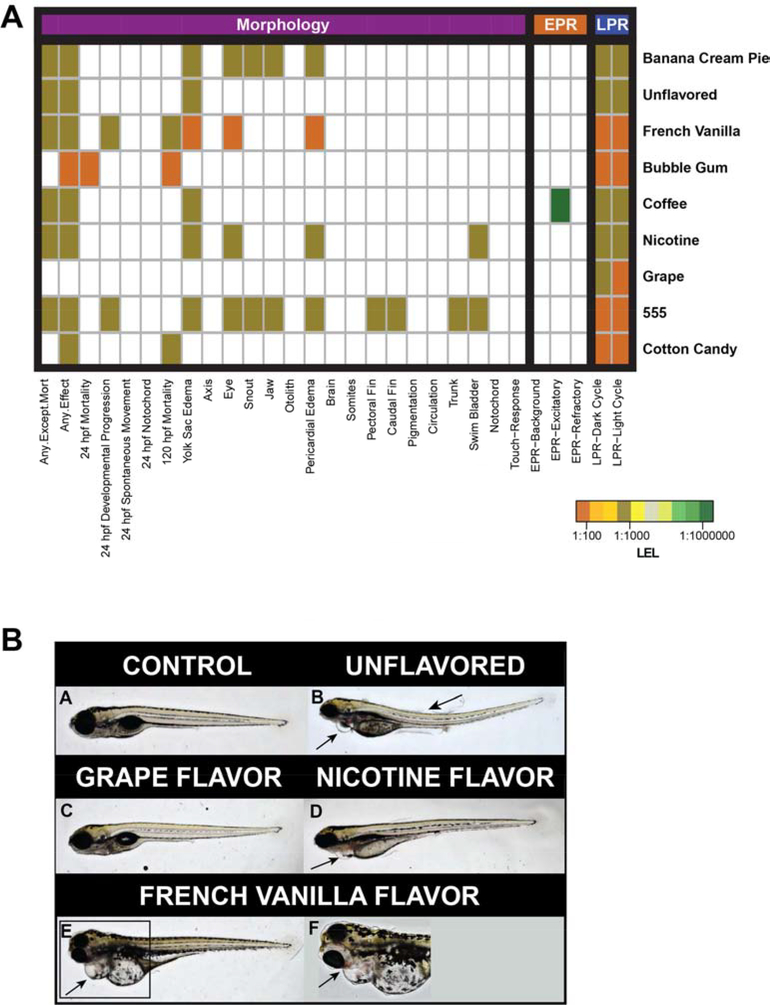
Figure 1.
A. Morphology and behavior outcomes in embryos exposed to nine commercial e-cigarette flavors. Color scale indicates relative potency, based upon the Lowest Effect Level (LEL) determined for a given mixture and endpoint. E-Cigarette flavors appear in the top right column. All morphological and behavioral endpoints are listed across the bottom of the figure. Orange color denotes greater potency (1:100 dilution factor), while green-blue colors indicate less potency (1:1000000 dilution factor). White indicates that there was no observable LEL for a particular mixture and endpoint. “Any Effect” and “Any Except Mortality” (left two columns) are aggregates of all morphological end points. The Unflavored mixture contained only PG and VG while the Nicotine flavor contained PG, VG and 24 mg/mL of Nicotine. Figure 1B. Representative images of 120 hpf zebrafish exposed to four different e-cigarette flavors. Images A-E were taken at 2X magnification using the bright field setting. Image F was taken at 10X magnification under the bright field setting. A: Control animal, exposed to 1:1000 PG:EM. B: 1:100 dilution of Unflavored e-cigarette flavor, presence of some edemas and a slightly curved body axis. C: 1:100 dilution of Grape flavor, note the lack of malformations. D: 1:100 dilution of Nicotine e-cigarette flavor, presence of some minor edemas. E and F: Zebrafish exposed to a 1:1000 dilution of French Vanilla flavor. Note the blood pooling in the eye and midbrain regions.

