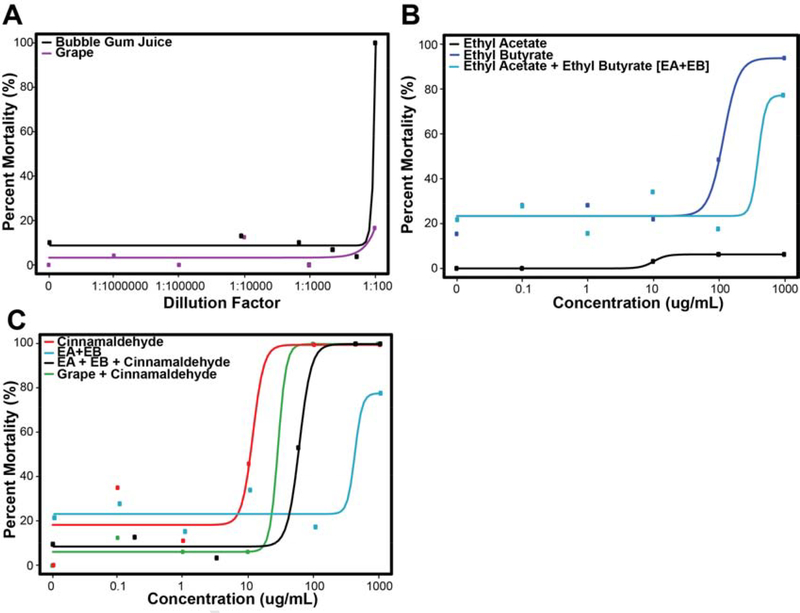
Figure 3. Concentration-mortality curves at 120 hpf associated with Bubble Gum and Grape flavors.
3A: Concentration-mortality curve for Bubble Gum is much steeper than Grape, suggesting an additional component(s) driving toxicity. 3B: Concentration-mortality curve of ethyl acetate, ethyl butyrate, and ethyl acetate + ethyl butyrate. Concentration is in units of ug/mL. 3C: Cinnamaldehyde, the ethyl acetate + ethyl butyrate + cinnamaldehyde mixture and the Grape mixture + cinnamaldehyde. The high mortality rate is recapitulated at the 100 and 1000 ug/mL cinnamaldehyde concentrations for both mixtures, suggesting the large role that cinnamaldehyde is likely playing in driving toxicity.

