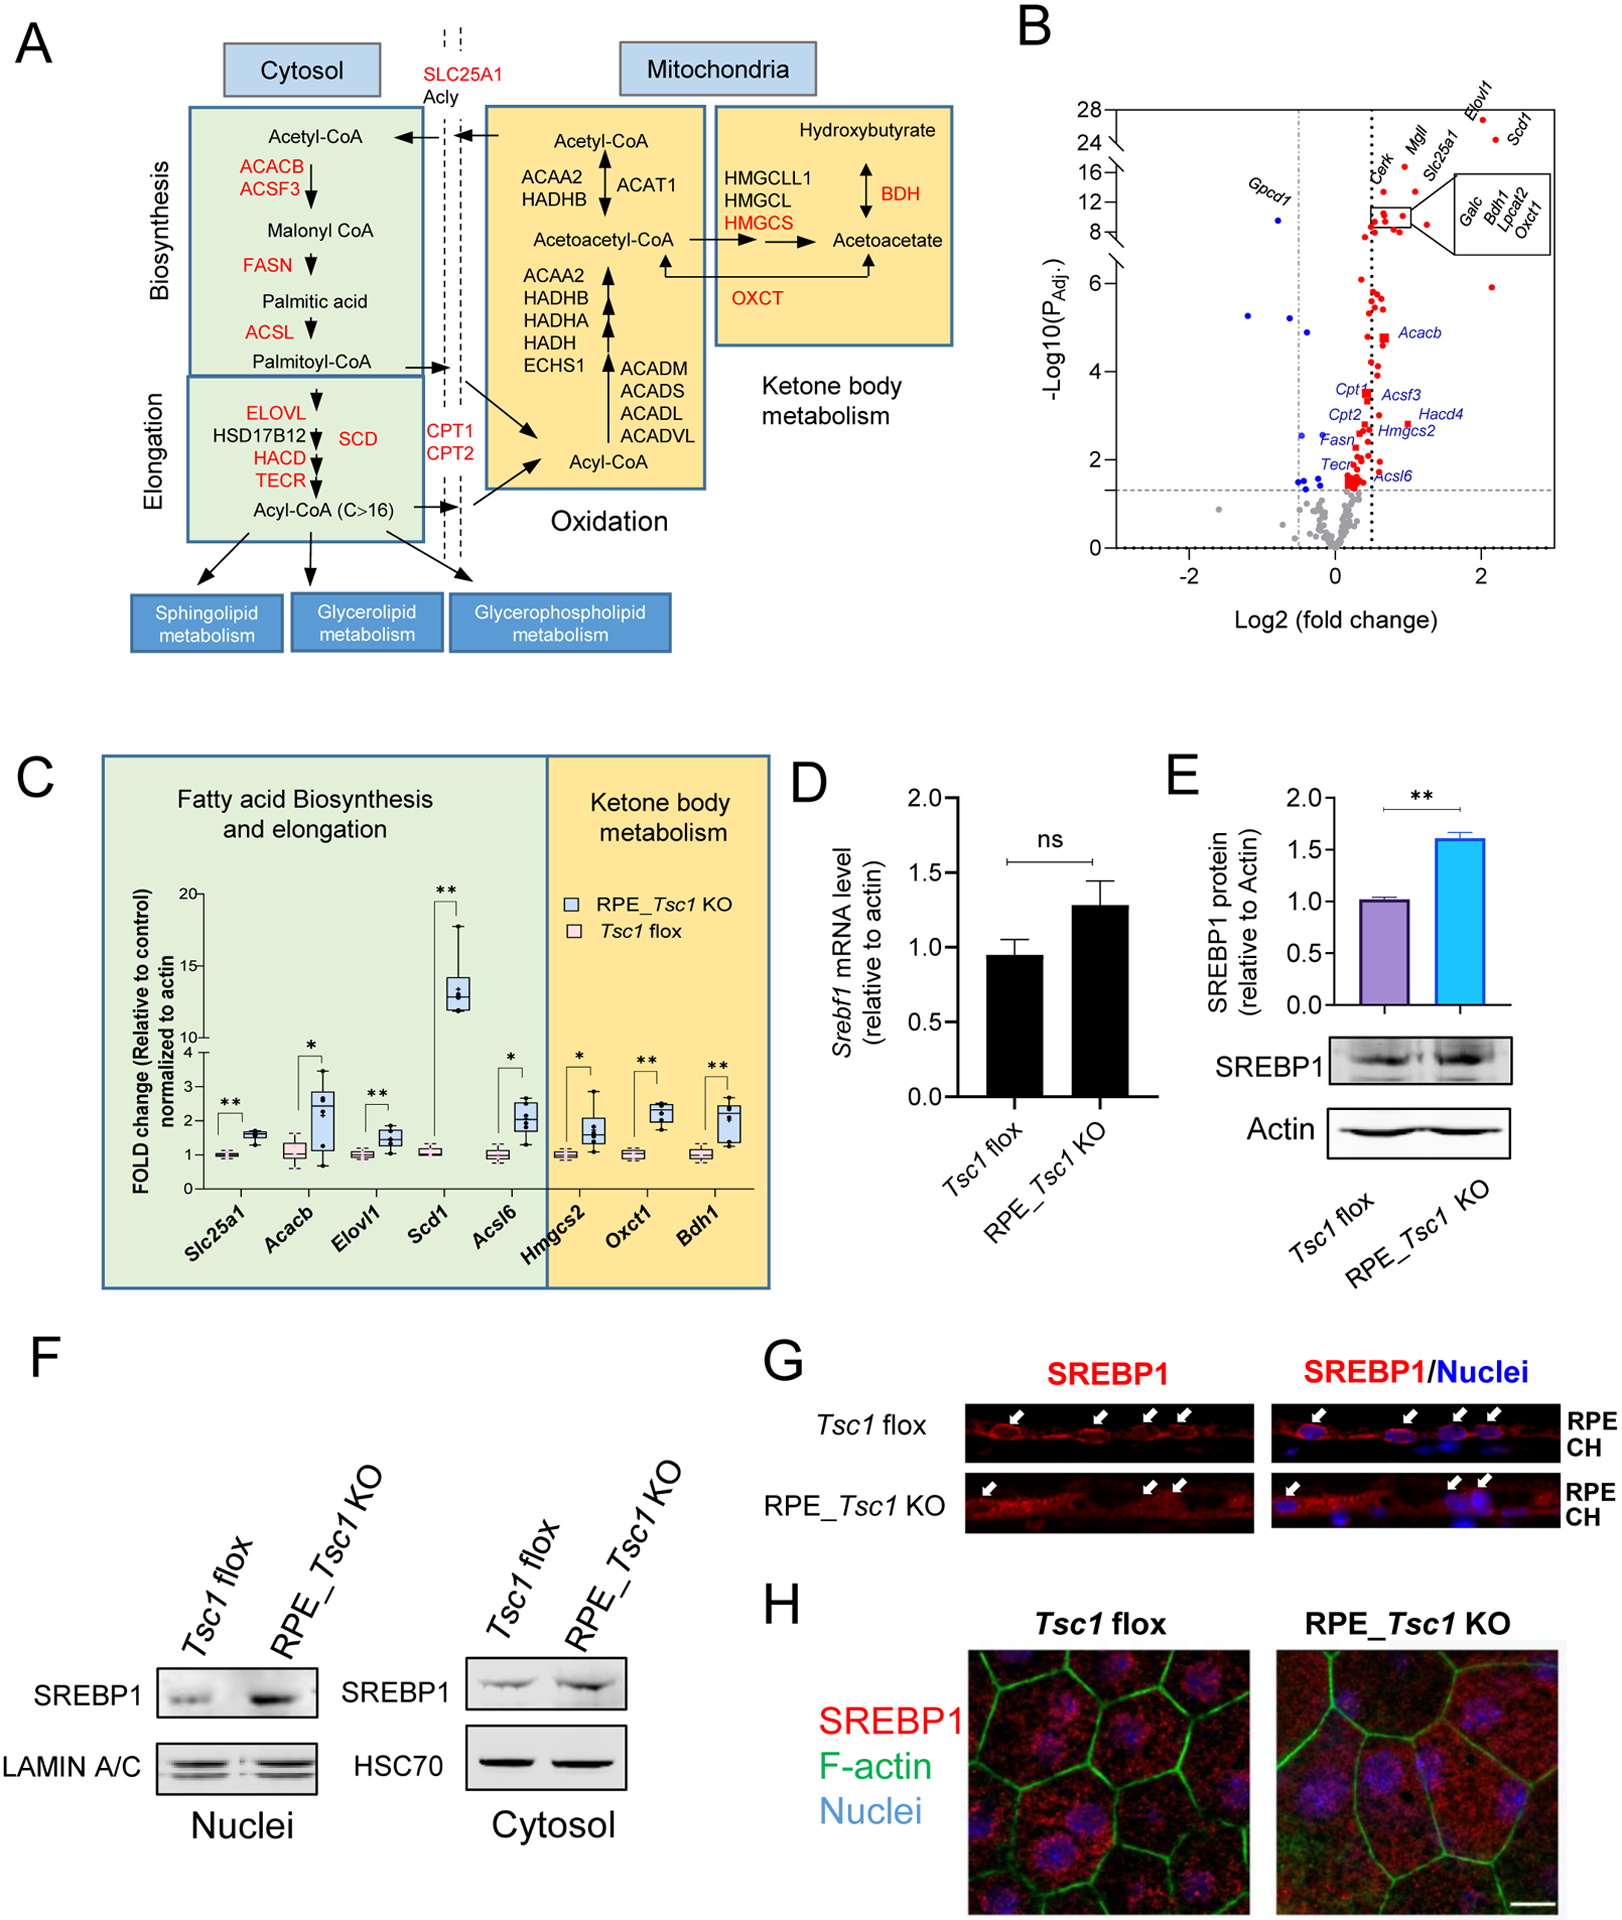
Fig. 5. Aberrant fatty acid biosynthesis and utilization in the Tsc1-deficient RPE.

(A) Schematic illustration of FA metabolic pathways. Genes showed upregulation by RNA-seq analysis in FA biosynthesis/elongation/degradation were highlighted in Red. (B) Volcano plot of differential gene expression between control and TSC1-deficient RPE from RNA-seq. The genes analyzed are involved in FA metabolic pathways including FA biosynthesis, elongation, degradation, glycerophospholipid metabolism, glycerolipid metabolism, and sphingolipid metabolism as illustrated in (A). The horizontal dotted line indicates adjusted p value of 0.05. The vertical dotted lines correspond to two-fold change. Blue indicates decreased expression, and red indicates increased expression in the Tsc1 KO RPE. The top 10 genes with most significant changes are labeled in black. (C) Quantitative RT-PCR of genes involved in fatty acid biosynthesis and utilization, after normalization to the expression level of β-actin. (* p < 0.05, ** p < 0.01, two-tailed Student’s t-test, 6 biological repeats for each group). (D) and (E) Comparison mRNA and protein level of SREBP1 between the RPE/choroid tissues isolated from control and RPE_Tsc1 KO mice. 7 and 3 biological replicates were used for each assay, respectively. (F) Subcellular distribution of SREBP1 in RPE tissue/choroid by western blot. (G) and (H) Immunostaining of SREBP1 on cryosection or flat mounted RPE/choroid tissue. Three biological repeats were used for each assay. Scale bar: 20 μm.
