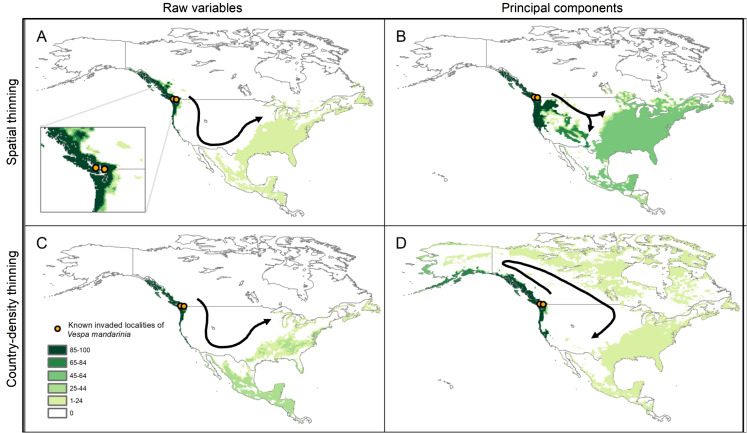
Figure 6. Results from simulations of the potential dynamics of invasion of Vespa mandarinia in North America.
Dark shades of green show areas that the species reached in a high percentage of scenarios, while light shades of green represent areas reached only rarely by the species. Arrows represent the general path of potential invasion. (A) Raw variables and spatially thinned occurrences; (B) Principal components predictors and spatially thinned occurrences; (C) Raw variables and country-density thinned occurrences; (D) Principal components predictors and country-density thinned occurrences.

