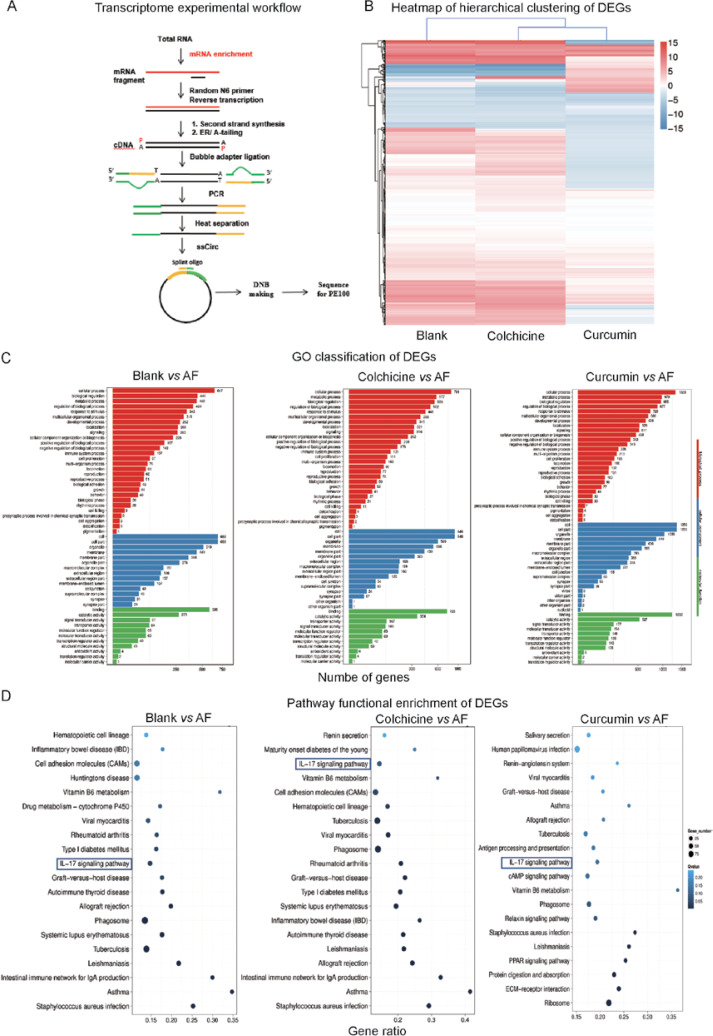
Figure 1.
A – Transcriptome experimental workflow. B – Heatmap of hierarchical clustering of DEGs among the blank group, AF group and Drugs treatment group (X axis represents each comparing sample. Y axis represents DEGs. Colouring indicates the log2 transformed fold change. High: red, Low: blue). C – The GO classification results among the blank group, AF group and Drugs treatment group (X axis represents number of DEG. Y axis represents GO term). D – Pathway classification of DEGs among the blank group, AF group and Drugs treatment group (X axis represents enrichment factor. Y axis represents the pathway name. The color indicates the q-value (high: white, low: blue), the lower q-value indicates the more significant enrichment. Point size indicates DEG number (The bigger dots refer to larger amounts). Rich Factor refers to the value of the enrichment factor, which is the quotient of foreground value (the number of DEGs) and background value (total Gene amount). The larger the value, the more significant enrichment

