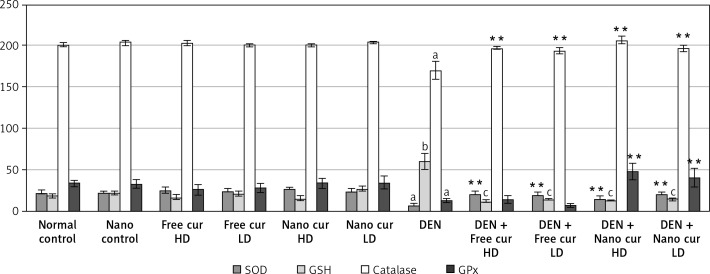
Figure 1.
Results of liver antioxidant enzymes in the different studied groups. Values are expressed as mean ± standard errors represented by vertical bars
**p < 0.01 significance increase than DEN, ap < 0.01 significant decrease than normal, bp < 0.001 significant increase than normal, cp < 0.001 significant decrease than DEN, SOD – superoxide dismutase, GSH – glutathione reduced, GPx – glutathione peroxidase

