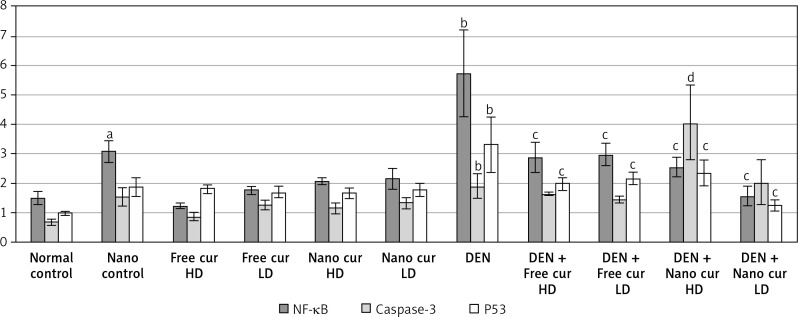
Figure 7.
Results of gene expression analysis of NF-κB, caspase-3, and P53 in the different studied groups. Values are expressed as mean ± standard errors represented by vertical bars
ap < 0.05 significant increase than normal, bp < 0.01 significant increase than normal, cp < 0.01 significant decrease than DEN, dp < 0.01 significant increase than DEN, NF-κB – nuclear factor κB, P53 – tumor suppressor P53.

