FIGURE 3.

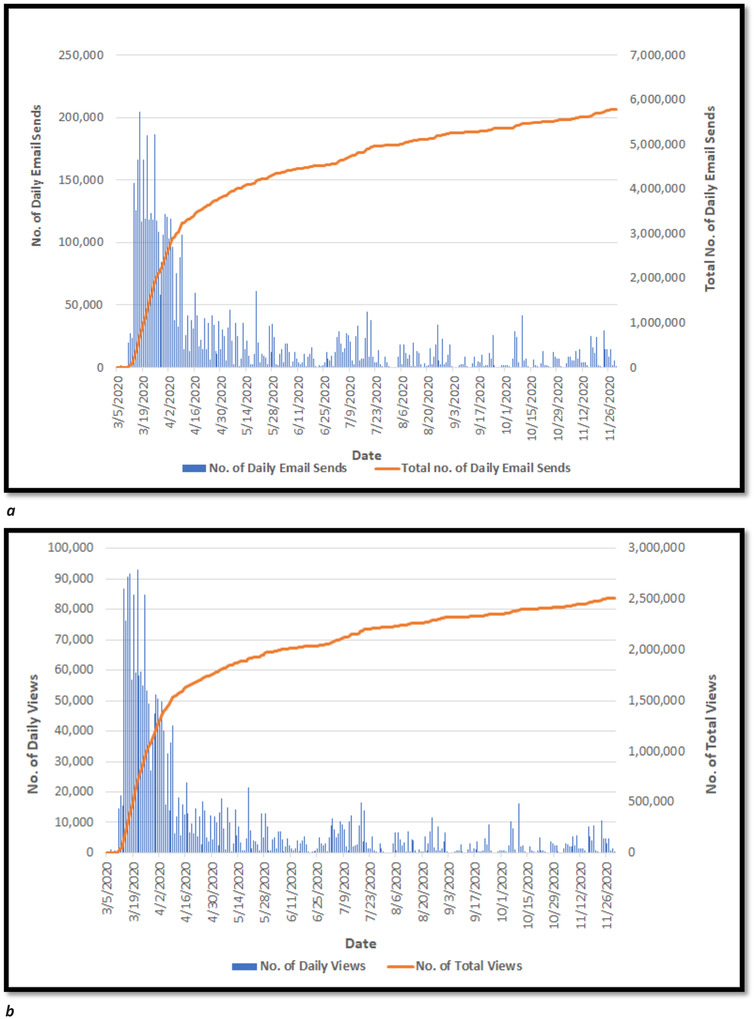
(a) Weekly trend for the number of daily and total emails sent using EngagED (during COVID‐19). (b) Weekly trend for the daily and total number of message views on EngagED (during COVID‐19)

(a) Weekly trend for the number of daily and total emails sent using EngagED (during COVID‐19). (b) Weekly trend for the daily and total number of message views on EngagED (during COVID‐19)