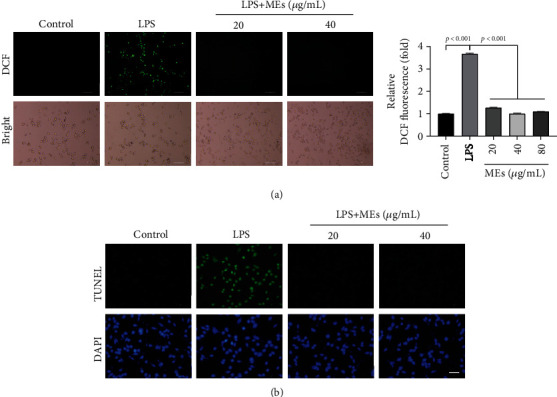
Figure 3.

MEs inhibit ROS generation in the activated microglia. (a) The endpoint microscope fluorescence image of intracellular ROS of BV2 cells. Intracellular ROS generation was measured by fluorescence staining with H2DCF-DA. LPS (200 ng/mL)-activated BV2 cells were treated with MEs (20 and 40 μg/mL), scale bar = 100 μm. The quantitative analysis of the fluorescence intensity of DCF shown in (a). (b) TUNEL staining. LPS (200 ng/mL)-activated BV2 cells were treated with MEs (20 and 40 μg/mL) for 24 h. DNA fragmentation was detected by TUNEL assay. Scale bar = 100 μm.
