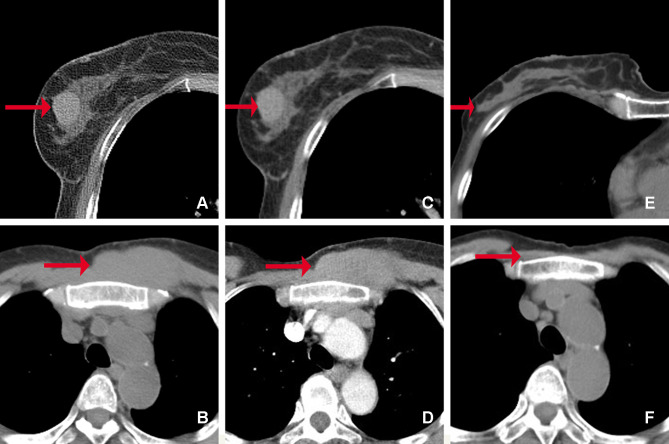
Figure 2.
CT images of the masses in the right breast and chest wall. Before treatment (A–D): (A) There was a well-defined slightly high-density mass in the right breast (arrow). (B) An ill-defined iso-density mass ís shown in the chest wall (arrow). The masses in the breast (C) and the chest wall (D) show homogeneous and mild enhancement on enhanced CT images (arrow). After treatment (E and F): the masses of the breast (E) and chest wall (F) disappeared (arrow).

