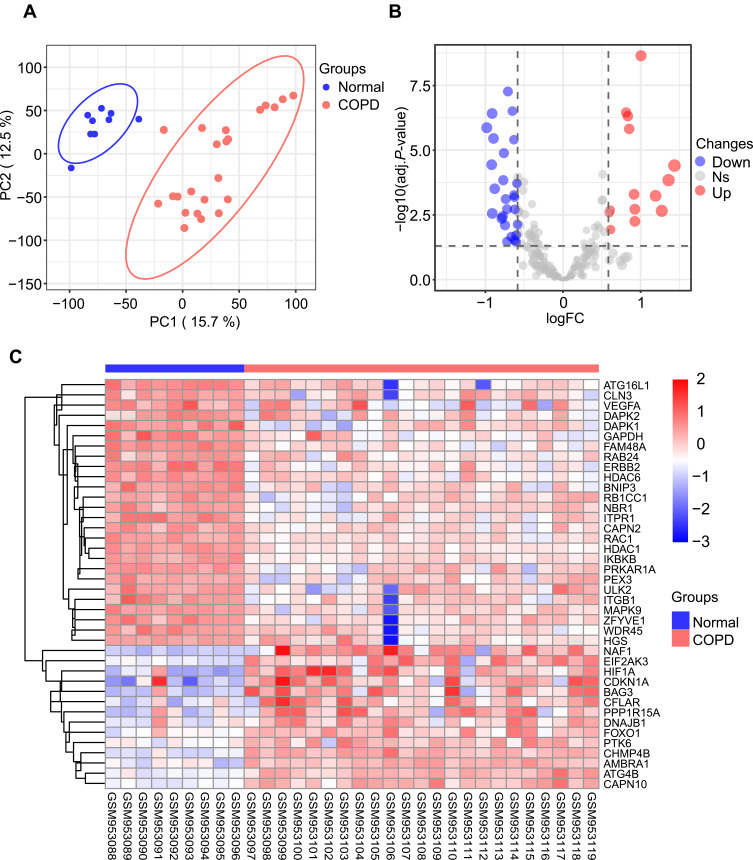
Figure 1.
Differentially expressed autophagy-related genes in COPD and healthy samples. (A) Principal component analysis for GSE38974. (B) Volcano plot of the 222 differentially expressed autophagy-related genes. The red dots represent the significantly up-regulated genes and the blue dots indicate the significantly down-regulated genes. (C) Heatmap of the 40 differentially expressed autophagy-related genes in COPD and healthy samples.

