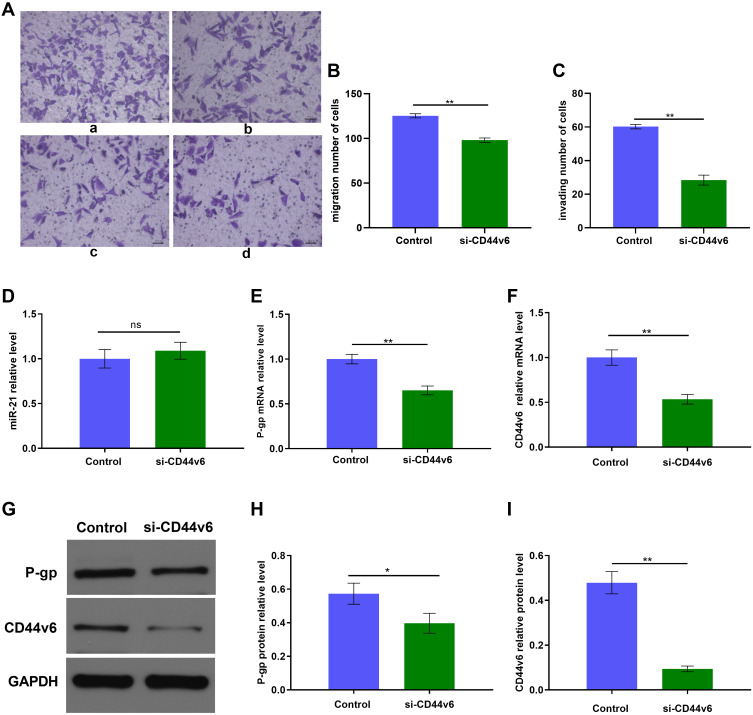
Figure 6.
siRNA knockdown of CD44v6 expression in SKOV3/DDP cells. (A) Migration and invasion of SKOV3/DDP cells, a: Control group, b: si-CD44v6 group; (B) and (C)Quantification of migrating and invading cells, c: Control group, d: si-CD44v6 group; qRT-PCR and Western blot detected (D) miR-21 expression level, (E) P-gp mRNA expression level, (F) CD44v6 mRNA expression level, (G) P-gp and CD44v6 Protein expression levels. (H) and (I) Gray value analysis of CD44v6 and P-gp protein bands. *P<0.05; **P<0.01.

