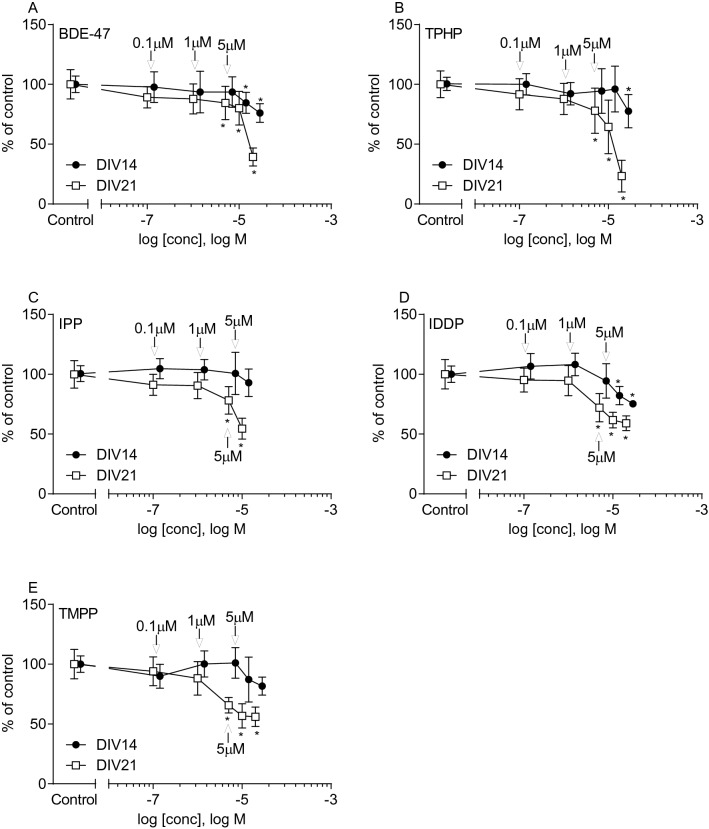
Fig. 2.
Cell viability at DIV14 (filled circle) and 21 (open square) using resazurin reduction assay after exposure at 7DIV to FR a BDE-47, b TPHP, c IPP, d IDDP and e TMPP. All data were normalized to mean of untreated control samples (100%) and are presented as mean ± SD of at least three independent experiments performed in 2–4 replicates. Differences between treated and non-treated (control) groups were assessed by one-way ANOVA (GraphPad Prism 8.4.3), followed by Dunnett’s multiple comparison post hoc test including correction for multiple testing. Post hoc test was only performed vs. controls. Statistical significance is indicated as follow *p < 0.05 (treated vs. control). Arrows indicate concentrations selected for metabolomics and transcriptomics experiments (0.1, 1 and 5 µM)

