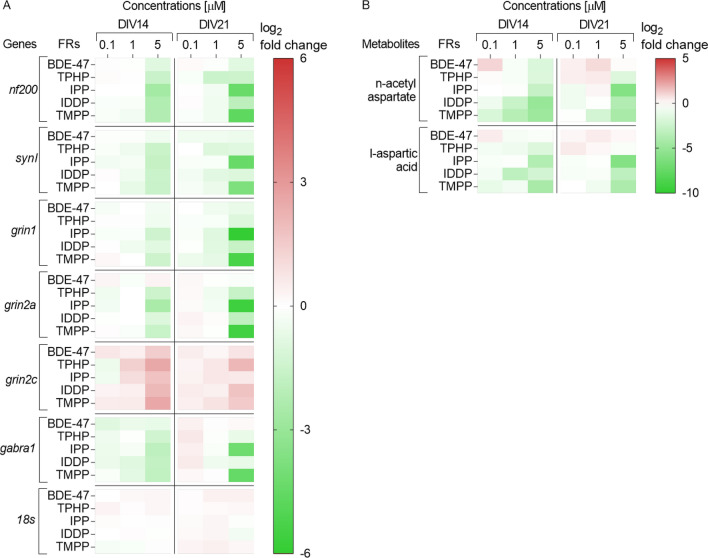
Fig. 3.
Heatmap (double gradient, green—minus; red—plus) illustrating (A) genes (measured with RT-qPCR) and (B) metabolites (measured with Q-TOF LC–MS), involved in neuronal morphology and function after exposure to FR. All data were normalized to mean of untreated control cells (0) and are displayed as means log2-fold change in each independent experiment, from at least three independent experiments performed in 2–3 replicates (genes) or at least two independent experiments performed in 4–6 replicates (metabolites)

