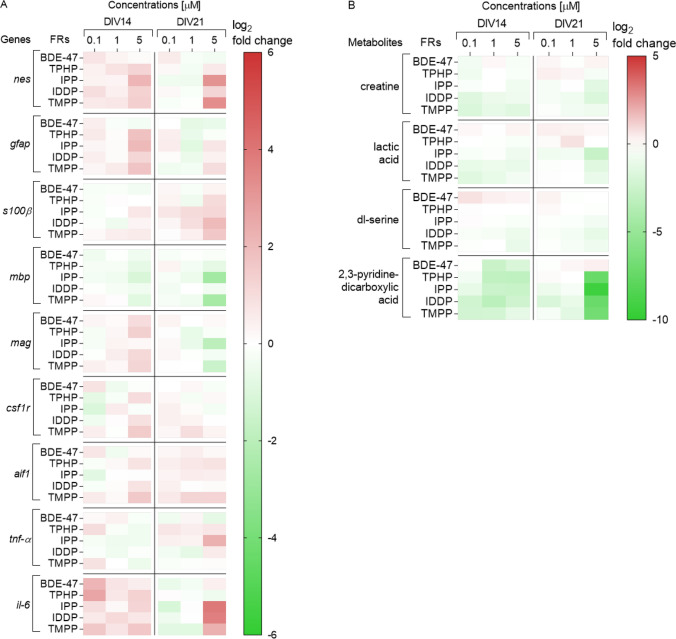
Fig. 5.
Heatmap (double gradient, green—minus; red—plus) illustrating a genes (measured with RT-qPCR) and b metabolites (measured with Q-TOF LC–MS), identified in glial cells (astrocytes, oligodendrocytes and microglia) after exposure to FR. All data were normalized to mean of untreated control cells (0) and are displayed as means log2-fold change in each independent experiment, from at least three independent experiments performed in 2–3 replicates (genes) or at least two independent experiments performed in 4–6 replicates (metabolites)

