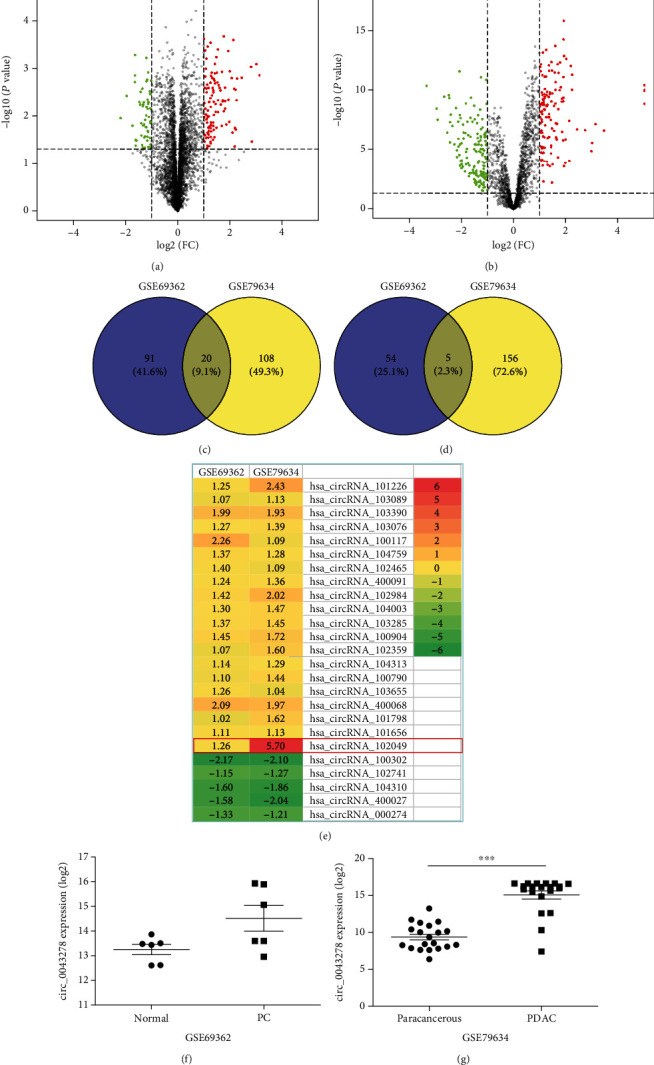
Figure 1.

Identification of differentially expressed circRNAs (DECs) between the PDAC and nonmalignant tissues. The volcano plots of DECs for GSE69362 (a) and GSE79634 (b) datasets. The Venn diagrams of the overlapping DECs, including 20 upregulated (c) and 5 downregulated (d), among the two datasets. (e) Heatmap of the twenty-five DECs in the two microarray datasets. The expression levels of hsa_circRNA_102049 (circ_0043278) in GSE69362 (f) and GSE79634 (g) datasets, respectively.
