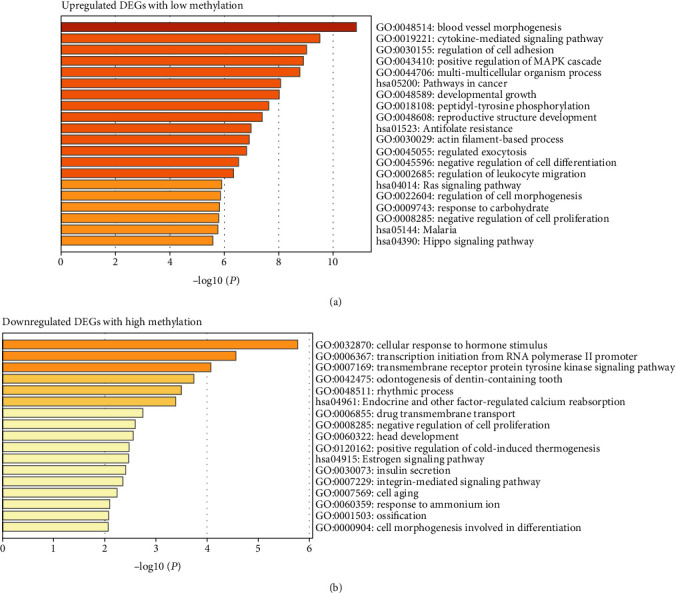
Figure 4.

GO and KEGG pathway enrichment analysis for the inflammation-associated methylated expressed genes. GO-BP terms and KEGG pathway enrichment analysis of upregulated DEGs with low methylation (a) and downregulated DEGs with high methylation (b).
