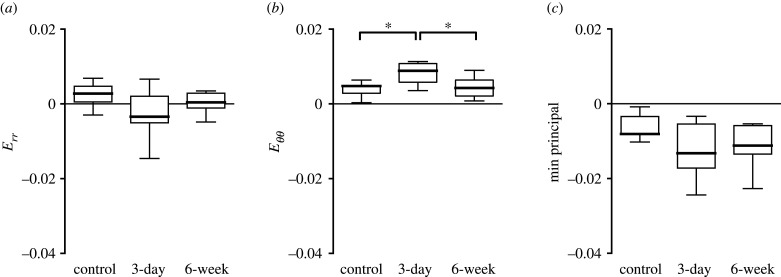
Figure 14.
Comparison of specimen-averaged strain among all experimental groups in the PPS. Control (n = 23), 3-day OHT (n = 13) and 6-week OHT (n = 11) eyes. (a) Err in the 3-day OHT group was compressive and 1.3 times that of the control (p = 0.05) and more compressive than the 6-week group (p = 0.38). (b) Eθθ in the 3-day OHT group was 1.9 times that of the control (p = 0.02). (c) Emin in the 3-day OHT group was 1.2 times that of the control (p = 0.05). *p < 0.05.

