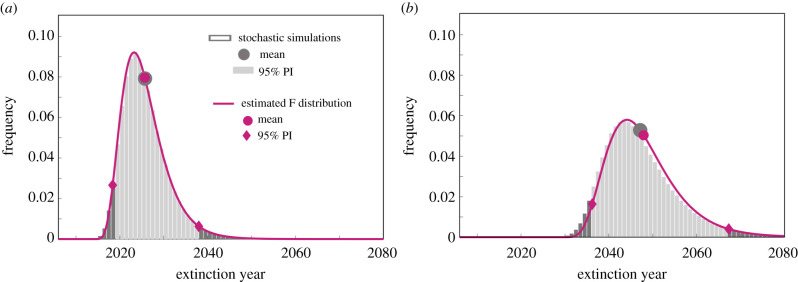
Figure 4.
Probability distribution of extinction time for the full (17-dimensional) gHAT model for two health zones, (a) Mosango and (b) Kwamouth with 30% active screening. Grey bars represent the solutions of one million stochastic simulations (light grey specifies 95% PI). The purple line shows the F distribution estimated from the first four moments of the simplified birth–death process approach (b = 0.42, d = 0.67 for Mosango and b = 0.48, d = 0.64 for Kwamouth). Corresponding mean values and 95% prediction intervals are indicated for each dataset.

