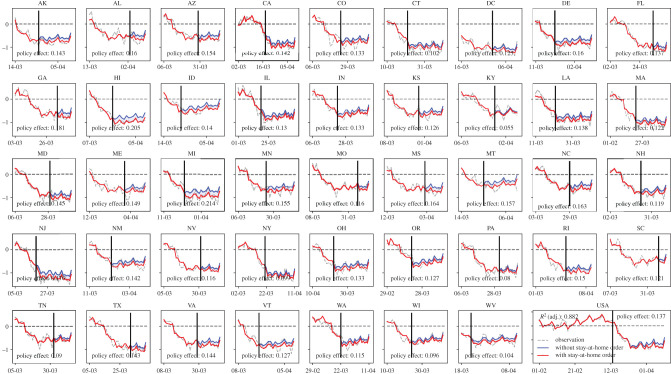
Figure 4.
Estimated daily trip increase/reduction per person at the national level and for each state, and the quantified policy effect of stay-at-home orders. In each subfigure, the red curve indicates the model prediction of the daily trip increase/reduction per person assuming with stay-at-home orders; the blue curve indicates the model prediction assuming without stay-at-home orders; policy effect indicates the estimated reduction in the daily number of trips per person that is solely attributed to the effect of stay-at-home orders; the solid vertical line indicates the effective date of the orders.

